Prevalence vs. Incidence: what is the difference?
Posted on 6th November 2020 by Georgina Ford

Articles often publish statistics in relation to prevalence and incidence of conditions or diseases. This is particularly topical as epidemiology has been discussed more widely in the media recently in relation to the COVID-19 crisis. Both prevalence and incidence are epidemiological measures showing information about disease in the population. This allows for evaluation of how often and in which people diseases occur, and planning for allocation of resources for the future.
The differences between prevalence and incidence may initially seem subtle but they do measure different aspects of disease occurrence.
Prevalence
Prevalence = the number of cases of a disease in a specific population at a particular timepoint or over a specified period of time.
When we talk about prevalence, we can either refer to ‘point prevalence’ or ‘period prevalence’.
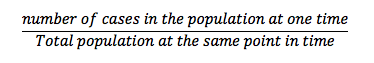
Point prevalence is the proportion of people with a particular disease at a particular timepoint and can be calculated as follows:
Period prevalence is the proportion of people with a particular disease during a given time period.
Prevalence is a useful measure of the burden of disease. Knowing about the prevalence of a specific disease can help us to understand the demands on health services to manage this disease.
Prevalence changes when people with the condition are cured or die. Bear in mind that increased prevalence doesn’t necessarily mean a bigger problem. Higher prevalence could mean a prolonged survival without cure or an increase of new cases, or both. A lower prevalence could mean that more people are dying rather than being cured, a rapid recovery, and/or a low number of new cases.
Incidence
Incidence = the rate of new cases of a disease occurring in a specific population over a particular period of time.
Two types of incidence are commonly used: ‘incidence proportion’ and ‘incidence rate’.
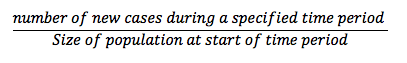
Incidence proportion, risk or cumulative incidence refers to the number of new cases in your population during a specified time period. It can be calculated using the following equation:
Incidence rate incorporates time directly into the denominator and can be calculated as follows:
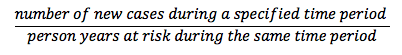
Person years at risk means the total amount of time (in years) that each person of the study population is at risk of the disease during the period of interest.
Prevalence differs from incidence proportion as prevalence includes all cases (new and pre-existing cases) in the population at the specified time whereas incidence is limited to new cases only.
The factor connecting prevalence and incidence statistics is the length of time the disease is present for before patients die, or are cured.
For example…
The number of people that are diagnosed with asthma every year is quite static over time. It has a genetic component, is not being affected hugely by lifestyle or other factors and the rate of cases does not particularly change. This means that the incidence of the disease stays fairly constant.
However, nowadays people do not die of asthma and the number of people with asthma in the population persists until they die of another cause. There is also not often a cure for asthma, it does not go away but it is just managed better. Therefore the number of cases of asthma keeps increasing while more people are diagnosed with the condition than those with the disease that die. The prevalence of asthma in a population is therefore increasing.
At the other end of the spectrum is a very short-lived condition with high mortality, such as Ebola. The number of cases of Ebola increased massively during the 2014-2016 epidemic, making the incidence extremely high. However, once it reached its peak the prevalence remained pretty constant as people died of the condition at approximately the same rate it was diagnosed, as the mortality was so high.
Now let’s put some actual numbers into a fictional example
A general practice surgery with a patient population of 40,000 people wanted to evaluate the epidemiology of COPD in its patients. The information they collected from their records is shown in the following table:
| Year | Number of Patients with COPD | Total number of patients at the practice |
| 2018 | 1780 | 39,640 |
| 2019 | 1826 | 40,000 |
* For simplicity, we assume that there were no deaths or recovery of patients with COPD during 2018 and 2019, and all the patients remained in the practice.
From this table we can say that:
- In 2018, the number of patients at the practice (total population) was 39,640. The number of people at that time with COPD was 1780. Therefore, the prevalence equals 1780/39640= 0.0449. This can be expressed as 4.5% of the patient population had COPD at that time.
- In 2019, the number of patients at the practice had increased to 40,000. The number of cases of COPD in 2019 had risen to 1826. The prevalence in 2019 therefore was 1826/40000= 0.0456 giving us 4.6% of the population.
- We can see the prevalence of COPD in this population only changed by approximately 0.1%.
- The number of new cases in 2019 compared to 2018 is 1826-1780, making the difference 46. Therefore, the number of new cases at the practice is 46 per year, which makes the incidence 46/40,000 =0.00115 (1.15 per 1000 population). (For simplicity this is assuming those 46 were all new patients with onset of COPD in 2019).
It is useful to use these numbers in combination. As we can see from this example, the incidence of COPD tells us 46 patients at the practice are being newly diagnosed. If the number of patients at the surgery had stayed the same, you might be worried that they had all suddenly developed risk factors such as began smoking heavily causing so many to have the condition. However, the prevalence considers the fact that the number of people in the total population had increased as well, and the proportion of the population with COPD in 2018 vs 2019 only changed by 0.1%. As a GP you could be reassured by this that as the number of new cases was proportional to the number of new patients you were taking on.
Other Tips
It really helps to draw yourself out a table with the time period, the population, and the number of cases to let you visualise what is going on. I have linked a video that gives a really clear explanation using a bathtub analogy, I highly recommend you take a look:
The following paper also explains the concept very well: Measures of Disease Frequency: Prevalence and Incidence.
Take-home point
Prevalence differs from incidence proportion as prevalence includes all cases (new and pre-existing cases) in the population at the specified time whereas incidence is limited to new cases only.


No Comments on Prevalence vs. Incidence: what is the difference?
This is quite educative and helpful.
Thank you very much
9th February 2024 at 6:15 pm