Multivariate analysis: an overview
Posted on 9th September 2021 by Vighnesh D

Overview
Data analysis is one of the most useful tools when one tries to understand the vast amount of information presented to them and synthesise evidence from it. There are usually multiple factors influencing a phenomenon.
Of these, some can be observed, documented and interpreted thoroughly while others cannot. For example, in order to estimate the burden of a disease in society there may be a lot of factors which can be readily recorded, and a whole lot of others which are unreliable and, therefore, require proper scrutiny. Factors like incidence, age distribution, sex distribution and financial loss owing to the disease can be accounted for more easily when compared to contact tracing, prevalence and institutional support for the same. Therefore, it is of paramount importance that the data which is collected and interpreted must be done thoroughly in order to avoid common pitfalls.
Image from: https://imgs.xkcd.com/comics/useful_geometry_formulas.png under Creative Commons License 2.5 Randall Munroe. xkcd.com.
Why does it sound so important?
Data collection and analysis is emphasised upon in academia because the very same findings determine the policy of a governing body and, therefore, the implications that follow it are the direct product of the information that is fed into the system.
Introduction
In this blog, we will discuss types of data analysis in general and multivariate analysis in particular. It aims to introduce the concept to investigators inclined towards this discipline by attempting to reduce the complexity around the subject.
Analysis of data based on the types of variables in consideration is broadly divided into three categories:
- Univariate analysis: The simplest of all data analysis models, univariate analysis considers only one variable in calculation. Thus, although it is quite simple in application, it has limited use in analysing big data. E.g. incidence of a disease.
- Bivariate analysis: As the name suggests, bivariate analysis takes two variables into consideration. It has a slightly expanded area of application but is nevertheless limited when it comes to large sets of data. E.g. incidence of a disease and the season of the year.
- Multivariate analysis: Multivariate analysis takes a whole host of variables into consideration. This makes it a complicated as well as essential tool. The greatest virtue of such a model is that it considers as many factors into consideration as possible. This results in tremendous reduction of bias and gives a result closest to reality. For example, kindly refer to the factors discussed in the “overview” section of this article.
Discussion
Multivariate analysis is defined as:
The statistical study of data where multiple measurements are made on each experimental unit and where the relationships among multivariate measurements and their structure are important
Multivariate statistical methods incorporate several techniques depending on the situation and the question in focus. Some of these methods are listed below:
- Regression analysis: Used to determine the relationship between a dependent variable and one or more independent variable.
- Analysis of Variance (ANOVA): Used to determine the relationship between collections of data by analyzing the difference in the means.
- Interdependent analysis: Used to determine the relationship between a set of variables among themselves.
- Discriminant analysis: Used to classify observations in two or more distinct set of categories.
- Classification and cluster analysis: Used to find similarity in a group of observations.
- Principal component analysis: Used to interpret data in its simplest form by introducing new uncorrelated variables.
- Factor analysis: Similar to principal component analysis, this too is used to crunch big data into small, interpretable forms.
- Canonical correlation analysis: Perhaps one of the most complex models among all of the above, canonical correlation attempts to interpret data by analysing relationships between cross-covariance matrices.
ANOVA remains one of the most widely used statistical models in academia. Of the several types of ANOVA models, there is one subtype that is frequently used because of the factors involved in the studies. Traditionally, it has found its application in behavioural research, i.e. Psychology, Psychiatry and allied disciplines. This model is called the Multivariate Analysis of Variance (MANOVA). It is widely described as the multivariate analogue of ANOVA, used in interpreting univariate data.

Image from: https://imgs.xkcd.com/comics/t_distribution.png under Creative Commons License 2.5 Randall Munroe. xkcd.com.
Interpretation of results
Interpretation of results is probably the most difficult part in the technique. The relevant results are generally summarized in a table with an associated text. Appropriate information must be highlighted regarding:
- Multivariate test statistics used
- Degrees of freedom
- Appropriate test statistics used
- Calculated p-value (p < x)
Reliability and validity of the test are the most important determining factors in such techniques.
Applications
Multivariate analysis is used in several disciplines. One of its most distinguishing features is that it can be used in parametric as well as non-parametric tests.
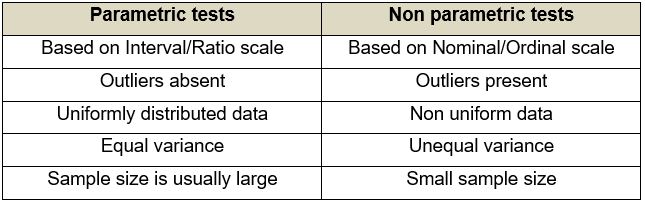
Quick question: What are parametric and non-parametric tests?
- Parametric tests: Tests which make certain assumptions regarding the distribution of data, i.e. within a fixed parameter.
- Non-parametric tests: Tests which do not make assumptions with respect to distribution. On the contrary, the distribution of data is assumed to be free of distribution.
Uses of Multivariate analysis: Multivariate analyses are used principally for four reasons, i.e. to see patterns of data, to make clear comparisons, to discard unwanted information and to study multiple factors at once. Applications of multivariate analysis are found in almost all the disciplines which make up the bulk of policy-making, e.g. economics, healthcare, pharmaceutical industries, applied sciences, sociology, and so on. Multivariate analysis has particularly enjoyed a traditional stronghold in the field of behavioural sciences like psychology, psychiatry and allied fields because of the complex nature of the discipline.
Conclusion
Multivariate analysis is one of the most useful methods to determine relationships and analyse patterns among large sets of data. It is particularly effective in minimizing bias if a structured study design is employed. However, the complexity of the technique makes it a less sought-out model for novice research enthusiasts. Therefore, although the process of designing the study and interpretation of results is a tedious one, the techniques stand out in finding the relationships in complex situations.


No Comments on Multivariate analysis: an overview
I got good information on multivariate data analysis and using mult variat analysis advantages and patterns.
1st June 2023 at 2:32 pmGreat summary. I found this very useful for starters
1st June 2023 at 6:15 amThank you so much for the dscussion on multivariate design in research. However, i want to know more about multiple regression analysis. Hope for more learnings to gain from you.
9th September 2022 at 10:31 amThank you for letting the author know this was useful, and I will see if there are any students wanting to blog about multiple regression analysis next!
21st September 2022 at 10:48 amWhen you want to know what contributed to an outcome what study is done?
4th April 2022 at 11:36 amDear Philip, Thank you for bringing this to our notice. Your input regarding the discussion is highly appreciated. However, since this particular blog was meant to be an overview, I consciously avoided the nuances to prevent complicated explanations at an early stage. I am planning to expand on the matter in subsequent blogs and will keep your suggestion in mind while drafting for the same. Many thanks, Vighnesh.
19th October 2021 at 8:16 amSorry, I don’t want to be pedantic, but shouldn’t we differentiate between ‘multivariate’ and ‘multivariable’ regression?
12th October 2021 at 6:55 pmhttps://stats.stackexchange.com/questions/447455/multivariable-vs-multivariate-regression
https://www.ajgponline.org/article/S1064-7481(18)30579-7/fulltext