The standardised mortality ratio and how to calculate it
Posted on 26th August 2020 by Anna Nicholls

What is a standardised mortality ratio (SMR)?
A standardised mortality ratio (SMR) describes whether a specific population (e.g. patients in a certain hospital) are more, less or equally as likely to die than a standard/ reference population (e.g. patients in all hospitals across the UK) (1).
Why do we use standardisation?
Crude death rates describe how many people die out of a given population over a specific time period but take no account of the population’s age distribution. Clearly, populations with a higher elderly population are likely to have a higher death rate. Therefore, it is often fairer to compare hospitals or trends in death rate over time with consideration for the population age distribution (1, 2).
Comparing each individual age and sex category is possible but with additional categories e.g. diagnosis, the data becomes unmanageable. Instead, standardisation gives us a single figure to compare the death rates in two populations whilst accounting for different population distributions. This conveys the information more simply although the trade-off is a loss of some information (2).
When to use the SMR
Mortality data can be standardised using the direct or the indirect method (3). Use the direct method when you know the age-sex-specific rates for the study population and the age-sex-structure of the standard population. Further details on direct standardisation and how to calculate it can be found in references 2-4 but it will not be discussed further in this blog.
The indirect method is used to calculate the SMR and is used when the age-specific rates for the study population are unknown or not available. This method uses the observed number of deaths in the study population and compares this to the number of deaths that would be expected if the age distribution was the same as that of the standard population (4). To minimise bias, the age-distribution of the standard population should be as similar as possible to the study population (5).
An advantage of using SMR is that the variance for indirectly standardised rates is lower than for directly standardised rates which gives more precise estimates. Therefore, where the number of deaths is small, which is often the case in hospitals, the SMR is favoured (5).
How is the SMR calculated?
The SMR is usually calculated using age- and sex-specific categories. A worked example is provided later.
SMR = number of observed deaths / number of expected deaths
To calculate the number of expected deaths:
A. Need age- and sex- specific death rates in the standard population (note that rates may be per 1000, per 10,000 or per 100,000 for rarer events).
B. Need estimate for the number of people in each category for each of the standard and the study populations.
C. Calculate the number of expected deaths in each age-sex group of study population (age-sex-specific rates in standard population (step A) x number of people in each category of study population (step B)).
D. Add all the age- and sex- specific expected deaths to get the expected number of deaths for the whole study population.
Finally, divide the observed number of deaths by the expected number of deaths. This gives the standardised mortality ratio.
What does the SMR mean?
- SMR < 1.0 indicates there were fewer than expected deaths in the study population
- SMR = 1.0 indicates the number of observed deaths equals the number of expected deaths in the study population
- SMR >1.0 indicates there were more than expected deaths in the study population (excess deaths)
Sometimes the SMR is expressed after multiplying by 100. In this case:
- < 100 indicates fewer than expected deaths
- = 100 indicates observed deaths equals expected deaths
- >100 indicates there were excess deaths
However, to determine whether the SMR is significant we need to calculate the 95% confidence intervals (CI).
95% CI = 1.96 x standard error of SMR
Standard error of SMR = (square root of observed deaths) / number of expected deaths
If the 95% confidence intervals do not cross 1.0 then the SMR is significant.
A worked example
The table below shows imaginary data for a standard population for the number of admissions to intensive care units (ICU) in a 1 year period and the age- and sex- categories of these patients. In an assessment of hospital A’s ICU quality of care we would like to know its standardised mortality ratio. The table shows the number of hospital A’s admissions according to age and sex categories and a calculation for the number of expected deaths in hospital A’s ICU. There were 149 observed deaths in hospital A.
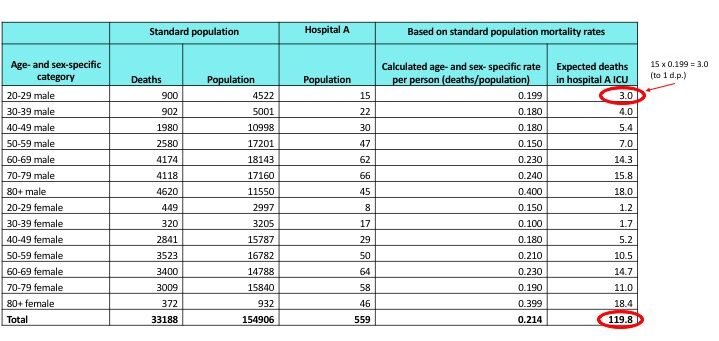
SMR = number of observed deaths / number of expected deaths
SMR = 149/119.8 = 1.24 (2 d.p.)
1.24 > 1.0, therefore there were excess deaths in hospital A’s ICU.
119.8 approximates to 120. Number of excess deaths = 149 -120 = 29 excess deaths.
The SMR could also be expressed as 124 (124 > 100, so again this shows excess deaths).
Is the SMR significant?
Standard error of SMR = (square root of 149) / 119.8
= 12.20656/119.8
= 0.10189
1.96 x 0.10189 = 0.200 to 3 d.p. (95% confidence interval, plus or minus)
Upper confidence interval = 1.24 + 0.200 = 1.44
Lower confidence interval = 1.24 – 0.200 = 1.04
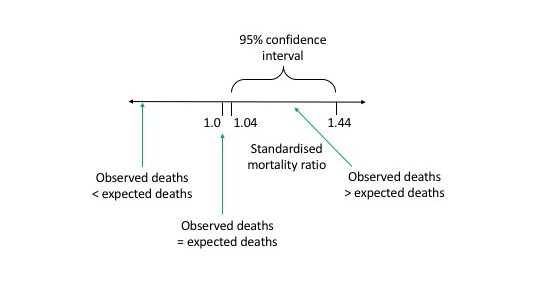
The 95% confidence interval does not cross 1.0 so the SMR is significant.
I have an SMR figure. What’s next?
The SMR has no intrinsic value, it is used for comparison purposes only (2). SMRs can be compared to an upper control limit and a lower control limit. Within these limits, data variation is consistent with random variation. Data points outside of these limits are unlikely to be due to change and warrant further investigation (either to investigate possible poor practice or to learn from high-performing areas) (6). A high SMR cannot tell us why there are excess deaths but it does suggest further investigation is required. Excess deaths may be:
- avoidable and should not have happened
- unexpected
- due to poor quality of care (7)
The SMR in practice
Factors other than age and sex also influence mortality rates. Therefore, other factors are often included in standardised mortality ratios. These factors may include (8 and 9):
- diagnosis
- deprivation
- co-morbidities
- whether the patient is for palliative care
- the procedure the patient had
- birthweight (when looking at infant mortality data)
To help with national reviews of hospital mortality another ratio called the Summary Hospital Mortality Indicator (SHMI) is used. There are different variants but two common ones are:
- Hospital Standardised Mortality Ratio (pdf) (HSMR) (8)
- Risk Adjusted Mortality Index (pdf) (RAMI) (9)
Advantages of SMR
- Records should be cheap and easy to obtain
- SMR is relatively simple to calculate
- You can map trends over time
- Mortality is unambiguous and therefore makes comparison between hospitals easier (6)
Limitations of SMR
- SMR depends on the choice of ‘standard’ population and therefore you can’t compare SMRs unless the same standard population was used
- If you don’t use an illness severity scoring system for the patients then you can’t be sure whether the people dying are critically ill or if an unusually high proportion were in good health before
- Morbidity data is not included – patients could survive after a hospital admission but be in very poor health afterwards
- Differing admission and discharge practices can influence the SMR. For example, patients for palliative care may be discharged and patients who are inevitably going to die could be admitted (6)


No Comments on The standardised mortality ratio and how to calculate it
The sum of expected deaths is wrong, should be 130.2
8th April 2023 at 5:59 amThe SMR is then no longer significant. A wonderful example how a simple calculation error changes the entire picture.
Your figure 0.214 seems to be 33188/154906. It takes no account of the age distribution.
8th November 2021 at 1:41 amIt seems to have been multiplied by 559 to give 119.8, which therefore has no dependence on age.
Expected deaths for each age should be added for the total, which gives a figure of 130.2.
The figure 0.233 (130.2/559) then replaces 0.214 and is simply a derived value.
This will then agree with the method of the example in your first reference.
It looks like you accidentally pasted the equation for each age into the total row.