A beginner’s guide to interpreting odds ratios, confidence intervals and p-values
Posted on 13th August 2013 by Tim Hicks

Who is it for?
Students of medicine or from the clinical sciences and professions allied to medicine wanting to enhance their understanding of medical literature they will encounter throughout their careers.
What will I learn and how?
How to interpret odds ratios, confidence intervals and p values with a stepwise progressive approach and a’concept check’ question as each new element is introduced.
How long will it take?
Approximately 20 minutes.
What it is not
A statistical textbook reworded or how to calculate any of these statistics.
Contents:
Introduction
Odds ratio
Confidence interval
P value
Bringing it all together – Real world example
Summary
Self test Answers
Introduction
The first steps in learning to understand and appreciate evidence-based medicine are daunting to say the least, especially when confronted with the myriad of statistics in any paper. This short tutorial aims to introduce healthcare students to the interpretation of some of the most commonly used statistics for reporting the results of medical research.
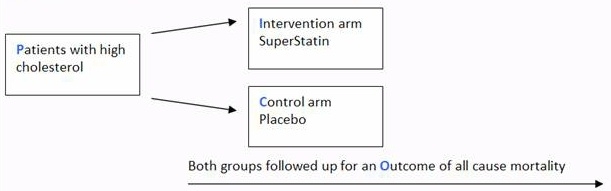
The scenario for this tutorial is centred around the diagram below, which outlines a fictional parallel two arm randomised controlled trial of a new cholesterol lowering medication against a placebo.
Odds ratio (OR)
An odds ratio is a relative measure of effect, which allows the comparison of the intervention group of a study relative to the comparison or placebo group.
So when researchers calculate an odds ratio they do it like this:
The numerator is the odds in the intervention arm
The denominator is the odds in the control or placebo arm = Odds Ratio (OR)
So if the outcome is the same in both groups the ratio will be 1, which implies there is no difference between the two arms of the study.
However:
If the OR is > 1 the control is better than the intervention.
If the OR is < 1 the intervention is better than the control.
Concept check 1
If the trial comparing SuperStatin to placebo with the outcome of all cause mortality found the following:
Odds of all cause mortality for SuperStatin were 0.4
Odds of all cause mortality for placebo were 0.8
Odds ratio would equal 0.5
So if the trial comparing SuperStatin to placebo stated OR 0.5
What would it mean?
A) The odds of death in the SuperStatin arm are 50% less than in the placebo arm.
B) There is no difference between groups
C) The odds of death in the placebo arm are 50% less than in the SuperStatin arm.
Confidence interval (CI)
The confidence interval indicates the level of uncertainty around the measure of effect (precision of the effect estimate) which in this case is expressed as an OR. Confidence intervals are used because a study recruits only a small sample of the overall population so by having an upper and lower confidence limit we can infer that the true population effect lies between these two points. Most studies report the 95% confidence interval (95%CI).
If the confidence interval crosses 1 (e.g. 95%CI 0.9-1.1) this implies there is no difference between arms of the study.
Concept check 2
So if the trial comparing SuperStatin to placebo stated OR 0.5 95%CI 0.4-0.6
What would it mean?
A) The odds of death in the SuperStatin arm are 50% less than in the placebo arm with the true population effect between 20% and 80%.
B) The odds of death in the SuperStatin arm are 50% less than in the placebo arm with the true population effect between 60% and 40%.
C) The odds of death in the SuperStatin arm are 50% less than in the placebo arm with the true population effect between 60% and up to 10% worse.
P values
P < 0.05 indicates a statistically significant difference between groups. P>0.05 indicates there is not a statistically significant difference between groups.
Concept check 3
So if the trial comparing SuperStatin to placebo stated OR 0.5 95%CI 0.4-0.6 p<0.01
What would it mean?
A) The odds of death in the SuperStatin arm are 50% less than in the placebo arm with the true population effect between 60% and 40%. This result was statistically significant.
B) The odds of death in the SuperStatin arm are 50% less than in the placebo arm with the true population effect between 60% and 40%. This result was not statistically significant.
C) The odds of death in the SuperStatin arm are 50% less than in the placebo arm with the true population effect between 60% and 40%. This result was equivocal.
Bringing it all together – Real world example
A drug company-funded double blind randomised controlled trial evaluated the efficacy of an adenosine receptor antagonist Cangrelor vs Clopidogrel in patients undergoing urgent or elective Percutaneous Coronary Intervention (PCI) who were followed up for specific complications for 48 hrs as outlined in the diagram below (Bhatt et al. 2009).
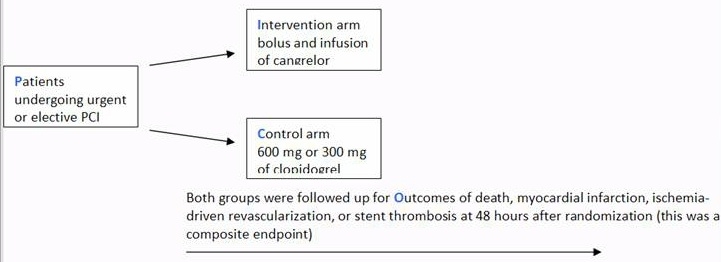
The results section reported “The rate of the primary efficacy end point was … (adjusted odds ratio with Cangrelor, 0.78; 95% confidence interval [CI], 0.66 to 0.93; P=0.005)
What does this mean?
A) The odds of death, myocardial infarction, ischemia-driven revascularization, or stent thrombosis at 48 hours after randomization in the Cangrelor arm were 22% less than in the Clopidogrel arm with the true population effect between 34% and 7%. This result was not statistically significant.
B) The odds of death, myocardial infarction, ischemia-driven revascularization, or stent thrombosis at 48 hours after randomization in the Cangrelor arm were 34% less than in the Clopidogrel arm with the true population effect between 7% and 22%. This result was statistically significant.
C) The odds of death, myocardial infarction, ischemia-driven revascularization, or stent thrombosis at 48 hours after randomization in the Cangrelor arm were 22% less than in the Clopidogrel arm with the true population effect between 34% and 7%. This result was statistically significant.
Summary
This is a very basic introduction to interpreting odds ratios, confidence intervals and p values only and should help healthcare students begin to make sense of published research, which can initially be a daunting prospect. However it should be stressed that any results are only valid if the study was well designed and conducted, which highlights the importance of critical appraisal as a key feature of evidence based medicine.
I do hope you enjoyed working through this and would appreciate any feedback on the content, design and presentational aspects of this tutorial.
Self test Answers
Concept check 1. The correct answer is A.
Concept check 2. The correct answer is B.
Concept check 3. The correct answer is A.
Bringing it all together – Real world example. The correct answer is C.
You may also be interested in these blogs:
Why should students know about kappa value?
Efficacy of drugs: 3 examples to get you to truly understand Number Needed to Treat (NNT)
Key to statistical result interpretation: P-value in plain English
Surrogate endpoints: pitfalls of easier questions
How did they determine diagnostic thresholds: the stories of anemia and diabetes
References:
Bhatt DL, Stone GW, Mahaffey KW, Gibson CM, Steg PG, Hamm CW, Price MJ, Leonardi S, Gallup D, Bramucci E, Radke PW, Widimský P, Tousek F, Tauth J, Spriggs D, McLaurin BT, Angiolillo DJ, Généreux P, Liu T, Prats J, Todd M, Skerjanec S, White HD, Harrington RA. CHAMPION PHOENIX Investigators. (2013). Effect of platelet inhibition with cangrelor during PCI on ischemic events. N Engl J Med. Apr 4;368(14):1303-13.


No Comments on A beginner’s guide to interpreting odds ratios, confidence intervals and p-values
Tim, I have a question, if you were studying a drug against a comparator and you had clinical study go out to 3 years but then patients had option to continue to 7 years, some continued other’s were lost to f/u now you see that those that continued past 3 years show good results and you want to make a comparative claim, if you do f/u to see if the patients are alive on the studied drug would you be able to use KM+CI or KM(kaplan myer)+HR+CI or KM+HR+CI+pvalue to describe your results in your label?
9th March 2015 at 7:00 amThanks. I like the simplicity of your presentation with the 3 quick check and then bringinging all together.
4th March 2015 at 8:52 pmTim,
I am confused when the CI is >1 and the OR is also >1??
If OR is 1.16 and CI 1.11-1.25 (for low complication rate associated with inserting an IO needle) and is considered in the paper to be a positive result. Then the OR for inserting a needle causes pain is 0.99 with CI 0.91-1.06. How is this interpreted?
That “the odds of IO placement are 84% likely when IV access is unsuccessful for 75-89% of the population”?
I am confused because my paper shows OR’s >1 and CI between 1-2 for many.
article ISSN: 1069-6563. doi: 10.1111/acem.12329
Thank you!
21st February 2015 at 10:40 pmTheresa
If the OR =o ???
26th January 2015 at 8:10 pm“If the OR is > 1 the control is better than the intervention.
If the OR is 1 the intervention is effective, but if OR < 1, the intervention is not.
24th January 2015 at 4:01 pmthanks so much for this. i spent the most part of my lecture confused and frustrated until i stumbled across this website!
22nd January 2015 at 2:07 pmHi Tim:
21st January 2015 at 3:17 pmI have to organize a table to show data with odds ratio, confidence intervals: Which of these data goes fiest on the table: the P or Odds ratio? Does it depend of the journal (I will submit my paper to “Pediatrics” but I can’t figure out on the Author’s guide). Thank you.
Rubin
Your explanation was quite simple and understandable. I’m a med doctor but studying MPH @ University of Derby. I’ve been quite fascinated in rewarding fields other than clinical medicine, can u give me some hints of ur view oe experience? cheers
29th December 2014 at 1:15 pmDear Tim,
Very helpful information indeed! Thank you!
I have a brief question please. Can I calculate the odds ration between the main group given a drug and the comparison group if these groups have different total number?
For instance, in a RCT, we have group A which is given bromide compared to group B which is given phenobarbital. In group A, a total number of 20 people were included and 10 of them developed side-effects. In group B a total number of 30 people were included and 5 of them developed side effects.
Therefore, could I calculate the odds ratio for the side effects between these two groups?
Sorry if the question sounds silly. ;- )
Thank you in advance for your time.
Kind regards,
Pete
18th December 2014 at 11:07 pmthank you so much, excellent
11th December 2014 at 9:16 amHi Tim, great article.
I do have a question:
In a paper I am appraising it states that patients in the intervention arm had a greater likelihood of response at 24 hours vs the active control.
It reports an Odds Ration of 2.18.
So are they saying one thing, and letting their OR report that control was actually better? Or am I misunderstanding?
Any help would be great,
Thanks
Suriya
7th December 2014 at 2:53 pmThat was very helpful. Thanks.
30th November 2014 at 12:13 pmHi Tim,
24th November 2014 at 12:32 amThank you very much for post. I has been helpful to me.
However, I am just new in using logistic regression, and doing my research in finance. My research is on effects of financial behaviour on the decision to use financial services. Therefore, the event is use or non use. I have run logistic regressions, some variables have OR more than 1.000. For instance saving behaviour has an OR of 4.0601. Would it be interpreted as saving behaviour increases the likelihood for using financial services by 406%. Would it make sense?
very useful Tim…thanks so much for your efforts!
26th October 2014 at 12:25 pmIf logistic regression analysis shown OR 1100. Does this OR correct? Does OR results can be range from zero to infinity ?
16th October 2014 at 5:34 amThank you.
Hello Liaw,
I’m not sure of the context of your result, but in principle a ratio can range from 0 to infinity. However 1100 is certainly an unusual result.
It’s perhaps worth noting that in regression analysis the OR is log transformed, for the purpose of the model, which means that the log transformed OR can range from minus infinity to plus infinity.
Once the model produces a result the log transformed OR antilog is calculated to convert it back into a ratio for interpretation.
Regards
Tim
19th October 2014 at 12:19 pmHow to find odds ratio, adjusted odds ratio and crude odds ratio in stata??
5th March 2016 at 5:11 pmThanks Tim! Did you know this blog has been viewed over 83,000 times since it was published!!!! :-)
9th September 2014 at 1:15 pmWow, that’s great I didn’t expect that! I do hope they stayed for more than 83000 seconds!
Best wishes
Tim
19th October 2014 at 12:17 pmThanks, 3rd year mature student nurse doing my dissertation and this has really helped explain things to me.
2nd September 2014 at 11:42 pmJust one question though, when you say that the CI is 0.9 to 1.1 how do you calculate this to a 60 and 40 percentage value? Apologies, never remember doing anything like this at school so I’m a bit dim.
Thanks
Hi Laura,
If the CI is 0.9 – 1.1 then it would be 10% less to 10% more, if you take a look at the question from Andrea and the reply I wrote to it, it will help with understanding why.
It’s great to see nursing students using the S4BE website, please be sure to let as many other students know about it as possible.
Best wishes
Tim
9th September 2014 at 12:03 pmUh… if OR > 1 then exposure is giving the effect you are looking for that is better than the control. If OR < 1, then the exposure is worsening the patients' condition.
31st August 2014 at 3:24 am