A beginner’s guide to interpreting odds ratios, confidence intervals and p-values
Posted on 13th August 2013 by Tim Hicks

Who is it for?
Students of medicine or from the clinical sciences and professions allied to medicine wanting to enhance their understanding of medical literature they will encounter throughout their careers.
What will I learn and how?
How to interpret odds ratios, confidence intervals and p values with a stepwise progressive approach and a’concept check’ question as each new element is introduced.
How long will it take?
Approximately 20 minutes.
What it is not
A statistical textbook reworded or how to calculate any of these statistics.
Contents:
Introduction
Odds ratio
Confidence interval
P value
Bringing it all together – Real world example
Summary
Self test Answers
Introduction
The first steps in learning to understand and appreciate evidence-based medicine are daunting to say the least, especially when confronted with the myriad of statistics in any paper. This short tutorial aims to introduce healthcare students to the interpretation of some of the most commonly used statistics for reporting the results of medical research.
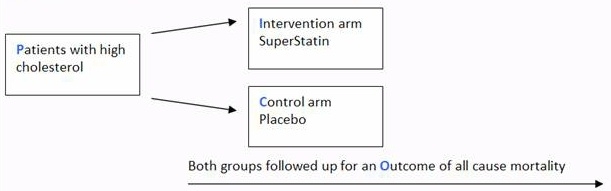
The scenario for this tutorial is centred around the diagram below, which outlines a fictional parallel two arm randomised controlled trial of a new cholesterol lowering medication against a placebo.
Odds ratio (OR)
An odds ratio is a relative measure of effect, which allows the comparison of the intervention group of a study relative to the comparison or placebo group.
So when researchers calculate an odds ratio they do it like this:
The numerator is the odds in the intervention arm
The denominator is the odds in the control or placebo arm = Odds Ratio (OR)
So if the outcome is the same in both groups the ratio will be 1, which implies there is no difference between the two arms of the study.
However:
If the OR is > 1 the control is better than the intervention.
If the OR is < 1 the intervention is better than the control.
Concept check 1
If the trial comparing SuperStatin to placebo with the outcome of all cause mortality found the following:
Odds of all cause mortality for SuperStatin were 0.4
Odds of all cause mortality for placebo were 0.8
Odds ratio would equal 0.5
So if the trial comparing SuperStatin to placebo stated OR 0.5
What would it mean?
A) The odds of death in the SuperStatin arm are 50% less than in the placebo arm.
B) There is no difference between groups
C) The odds of death in the placebo arm are 50% less than in the SuperStatin arm.
Confidence interval (CI)
The confidence interval indicates the level of uncertainty around the measure of effect (precision of the effect estimate) which in this case is expressed as an OR. Confidence intervals are used because a study recruits only a small sample of the overall population so by having an upper and lower confidence limit we can infer that the true population effect lies between these two points. Most studies report the 95% confidence interval (95%CI).
If the confidence interval crosses 1 (e.g. 95%CI 0.9-1.1) this implies there is no difference between arms of the study.
Concept check 2
So if the trial comparing SuperStatin to placebo stated OR 0.5 95%CI 0.4-0.6
What would it mean?
A) The odds of death in the SuperStatin arm are 50% less than in the placebo arm with the true population effect between 20% and 80%.
B) The odds of death in the SuperStatin arm are 50% less than in the placebo arm with the true population effect between 60% and 40%.
C) The odds of death in the SuperStatin arm are 50% less than in the placebo arm with the true population effect between 60% and up to 10% worse.
P values
P < 0.05 indicates a statistically significant difference between groups. P>0.05 indicates there is not a statistically significant difference between groups.
Concept check 3
So if the trial comparing SuperStatin to placebo stated OR 0.5 95%CI 0.4-0.6 p<0.01
What would it mean?
A) The odds of death in the SuperStatin arm are 50% less than in the placebo arm with the true population effect between 60% and 40%. This result was statistically significant.
B) The odds of death in the SuperStatin arm are 50% less than in the placebo arm with the true population effect between 60% and 40%. This result was not statistically significant.
C) The odds of death in the SuperStatin arm are 50% less than in the placebo arm with the true population effect between 60% and 40%. This result was equivocal.
Bringing it all together – Real world example
A drug company-funded double blind randomised controlled trial evaluated the efficacy of an adenosine receptor antagonist Cangrelor vs Clopidogrel in patients undergoing urgent or elective Percutaneous Coronary Intervention (PCI) who were followed up for specific complications for 48 hrs as outlined in the diagram below (Bhatt et al. 2009).
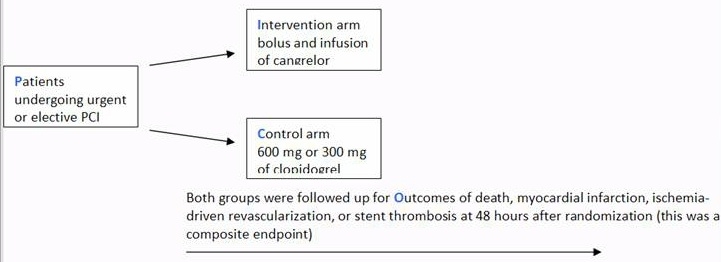
The results section reported “The rate of the primary efficacy end point was … (adjusted odds ratio with Cangrelor, 0.78; 95% confidence interval [CI], 0.66 to 0.93; P=0.005)
What does this mean?
A) The odds of death, myocardial infarction, ischemia-driven revascularization, or stent thrombosis at 48 hours after randomization in the Cangrelor arm were 22% less than in the Clopidogrel arm with the true population effect between 34% and 7%. This result was not statistically significant.
B) The odds of death, myocardial infarction, ischemia-driven revascularization, or stent thrombosis at 48 hours after randomization in the Cangrelor arm were 34% less than in the Clopidogrel arm with the true population effect between 7% and 22%. This result was statistically significant.
C) The odds of death, myocardial infarction, ischemia-driven revascularization, or stent thrombosis at 48 hours after randomization in the Cangrelor arm were 22% less than in the Clopidogrel arm with the true population effect between 34% and 7%. This result was statistically significant.
Summary
This is a very basic introduction to interpreting odds ratios, confidence intervals and p values only and should help healthcare students begin to make sense of published research, which can initially be a daunting prospect. However it should be stressed that any results are only valid if the study was well designed and conducted, which highlights the importance of critical appraisal as a key feature of evidence based medicine.
I do hope you enjoyed working through this and would appreciate any feedback on the content, design and presentational aspects of this tutorial.
Self test Answers
Concept check 1. The correct answer is A.
Concept check 2. The correct answer is B.
Concept check 3. The correct answer is A.
Bringing it all together – Real world example. The correct answer is C.
You may also be interested in these blogs:
Why should students know about kappa value?
Efficacy of drugs: 3 examples to get you to truly understand Number Needed to Treat (NNT)
Key to statistical result interpretation: P-value in plain English
Surrogate endpoints: pitfalls of easier questions
How did they determine diagnostic thresholds: the stories of anemia and diabetes
References:
Bhatt DL, Stone GW, Mahaffey KW, Gibson CM, Steg PG, Hamm CW, Price MJ, Leonardi S, Gallup D, Bramucci E, Radke PW, Widimský P, Tousek F, Tauth J, Spriggs D, McLaurin BT, Angiolillo DJ, Généreux P, Liu T, Prats J, Todd M, Skerjanec S, White HD, Harrington RA. CHAMPION PHOENIX Investigators. (2013). Effect of platelet inhibition with cangrelor during PCI on ischemic events. N Engl J Med. Apr 4;368(14):1303-13.


No Comments on A beginner’s guide to interpreting odds ratios, confidence intervals and p-values
Tim,
13th August 2015 at 4:58 pmThank you for a wonderfully simple and memorable explanation of something I should know but have always struggled to grasp ( until now!)
Thanks Tim for your explanation. Why is it important to also look at the odds ratio after calculating chi square?
7th August 2015 at 3:03 amHello Sir, Thank yoou very much. you have explaind odds ratio very nicely. no vague information (which makes me confuse) examples are also very easy to understand. you are very focused on what exactly you want to tell us. it was “to the point” and yes with that focus I also received.
31st July 2015 at 11:52 amThank you very much for making me understand statistics.
Please is there an acceptable range for the confidence interval (CI) and the Odd Ratio (OR)
28th June 2015 at 12:34 amIf you have a confidence interval that is between 0.4-1.3 obviously this crosses 1. If you increase the number of people in the study can this prevent the CI from crossing 1.
19th June 2015 at 4:04 amI found it very useful.
14th June 2015 at 2:52 pmThis really is awesome!!! Have had two semesters of biostatistics and epidemiology and this really puts everything together. Thank you for keeping it so straightfoward.
2nd June 2015 at 8:13 amExcellent work! Appreciated and very helpful
30th May 2015 at 7:01 pmYour interpretation of the Odds Ratio in Concept Check 1 seems to be wrong. The paper “The odds ratio: cal cu la tion, usa ge, and inter pre ta tion” by Mary L. McHugh (2009) states: “An OR of less than 1 means that the first group was less likely to experience the event. However, an OR value below 1.00 is not directly interpretable. The degree to which the first group is less likely to experience the event is not the OR result. It is important to put the group expected to have higher odds of the event in the first column. It is not valid to try to determine how much less the first group’s odds of the event was than the second group’s.” (page 5)
Paper available online:
30th May 2015 at 2:31 pmhttp://www.researchgate.net/publictopics.PublicPostFileLoader.html?id=520cd99cd039b1c948496440&key=72e7e520cd99bf05e5
Unless I’m mistaken, the equation explained above does not properly describe Odds Ratio, it describes Relative Risk. Odds Ratio is the odds that the diseased group was exposed, divided by odds that the non-diseased group was exposed (a/c)/(b/d) in the classic table. Relative Risk is the risk of developing disease in the exposed/intervention group, that is to say: the odds of disease in the intervention arm divided by the odds of disease in the placebo arm (which is what is described above).
27th May 2015 at 6:58 pmHi Hank
Odds ratio can be calculated either with odds of exposure or odds of outcome. In case-control design, you would only know odds of exposure like you described. In a different design, ratio of odds of outcome is the way to go. These are the same mathematically which can be seen by playing with the 2 x 2 -table. Relative risk, risk ratio, or ‘incidence proportion ratio’ differ from odds ratio so that odds are not used but proportions/probabilities.
2nd September 2015 at 4:09 pmI like the examples that you give
20th May 2015 at 4:05 amthe name of the article is indoor air pollution from biomass combustion and acute respiratory illness in preschool age children in zimbabwe
and my question is
16th May 2015 at 12:35 pminterpret in your own words the OR of 2.20 for the high pollution fuel and comment on the statistical “significance” of this result.
Hi i have a question it is related to statically significant for my assignment. I have an odds ration of 2.20 (1.16, 4.19) so how would i comment or workout on the statistical significance of this result.
15th May 2015 at 9:07 amit would be really helpful.
thanks
In Bringing it all together – Real world example. The correct answer is C.
Can you explain where 22
7 and 34 came from in your answer
Thanks?
9th May 2015 at 9:09 pmDear Tim,
4th May 2015 at 8:49 amI assure you that, you can be a wonderful professor. You can clearly present in a simple manner for a good learner to understand. Keep sharing
Thank you so much for the tutorial and explanations, Tim! They were so helpful for my EBM project. :)
2nd May 2015 at 4:18 pmI was just working with Spss a while ahead of ma search to this very potent solution for odds ratio abd confidence interval. I thank you anyways. I am also Physiologist would you please suggest me from experience the area of physiology i shall continue for Phd program?
1st May 2015 at 5:12 pmI love this anyways…
Hi
1st May 2015 at 12:18 pmThanks so much for these explanation. But how does this relate to standardized coefficient Gotten when one does a binary regression on spss or other statistical package. E.g A logistic regression of factors associated with uptake of HIV counselling and testing in the study group; condom use (none use) Standardized coefficient B= -0.44, OR=0.65, sig.= 0.03, C.I;0.43,0.97.
wish I could paste a table of results I got when I did my analysis.Pls interprete this result. Thanks.
What about, if they are not using it properly?
5th September 2015 at 3:06 pmWhat would an odds ratio >1 mean then? For example 2.5?
8th April 2015 at 11:22 amthanks for making my day bright, you have enable me now to interpret data
6th April 2015 at 1:03 pm