A beginner’s guide to interpreting odds ratios, confidence intervals and p-values
Posted on 13th August 2013 by Tim Hicks

Who is it for?
Students of medicine or from the clinical sciences and professions allied to medicine wanting to enhance their understanding of medical literature they will encounter throughout their careers.
What will I learn and how?
How to interpret odds ratios, confidence intervals and p values with a stepwise progressive approach and a’concept check’ question as each new element is introduced.
How long will it take?
Approximately 20 minutes.
What it is not
A statistical textbook reworded or how to calculate any of these statistics.
Contents:
Introduction
Odds ratio
Confidence interval
P value
Bringing it all together – Real world example
Summary
Self test Answers
Introduction
The first steps in learning to understand and appreciate evidence-based medicine are daunting to say the least, especially when confronted with the myriad of statistics in any paper. This short tutorial aims to introduce healthcare students to the interpretation of some of the most commonly used statistics for reporting the results of medical research.
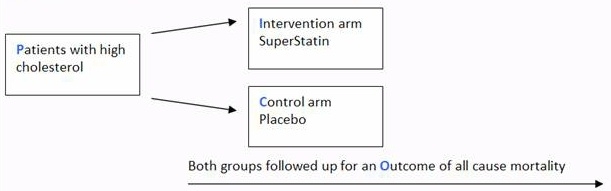
The scenario for this tutorial is centred around the diagram below, which outlines a fictional parallel two arm randomised controlled trial of a new cholesterol lowering medication against a placebo.
Odds ratio (OR)
An odds ratio is a relative measure of effect, which allows the comparison of the intervention group of a study relative to the comparison or placebo group.
So when researchers calculate an odds ratio they do it like this:
The numerator is the odds in the intervention arm
The denominator is the odds in the control or placebo arm = Odds Ratio (OR)
So if the outcome is the same in both groups the ratio will be 1, which implies there is no difference between the two arms of the study.
However:
If the OR is > 1 the control is better than the intervention.
If the OR is < 1 the intervention is better than the control.
Concept check 1
If the trial comparing SuperStatin to placebo with the outcome of all cause mortality found the following:
Odds of all cause mortality for SuperStatin were 0.4
Odds of all cause mortality for placebo were 0.8
Odds ratio would equal 0.5
So if the trial comparing SuperStatin to placebo stated OR 0.5
What would it mean?
A) The odds of death in the SuperStatin arm are 50% less than in the placebo arm.
B) There is no difference between groups
C) The odds of death in the placebo arm are 50% less than in the SuperStatin arm.
Confidence interval (CI)
The confidence interval indicates the level of uncertainty around the measure of effect (precision of the effect estimate) which in this case is expressed as an OR. Confidence intervals are used because a study recruits only a small sample of the overall population so by having an upper and lower confidence limit we can infer that the true population effect lies between these two points. Most studies report the 95% confidence interval (95%CI).
If the confidence interval crosses 1 (e.g. 95%CI 0.9-1.1) this implies there is no difference between arms of the study.
Concept check 2
So if the trial comparing SuperStatin to placebo stated OR 0.5 95%CI 0.4-0.6
What would it mean?
A) The odds of death in the SuperStatin arm are 50% less than in the placebo arm with the true population effect between 20% and 80%.
B) The odds of death in the SuperStatin arm are 50% less than in the placebo arm with the true population effect between 60% and 40%.
C) The odds of death in the SuperStatin arm are 50% less than in the placebo arm with the true population effect between 60% and up to 10% worse.
P values
P < 0.05 indicates a statistically significant difference between groups. P>0.05 indicates there is not a statistically significant difference between groups.
Concept check 3
So if the trial comparing SuperStatin to placebo stated OR 0.5 95%CI 0.4-0.6 p<0.01
What would it mean?
A) The odds of death in the SuperStatin arm are 50% less than in the placebo arm with the true population effect between 60% and 40%. This result was statistically significant.
B) The odds of death in the SuperStatin arm are 50% less than in the placebo arm with the true population effect between 60% and 40%. This result was not statistically significant.
C) The odds of death in the SuperStatin arm are 50% less than in the placebo arm with the true population effect between 60% and 40%. This result was equivocal.
Bringing it all together – Real world example
A drug company-funded double blind randomised controlled trial evaluated the efficacy of an adenosine receptor antagonist Cangrelor vs Clopidogrel in patients undergoing urgent or elective Percutaneous Coronary Intervention (PCI) who were followed up for specific complications for 48 hrs as outlined in the diagram below (Bhatt et al. 2009).
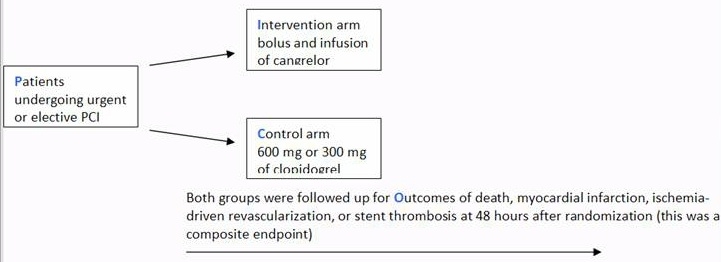
The results section reported “The rate of the primary efficacy end point was … (adjusted odds ratio with Cangrelor, 0.78; 95% confidence interval [CI], 0.66 to 0.93; P=0.005)
What does this mean?
A) The odds of death, myocardial infarction, ischemia-driven revascularization, or stent thrombosis at 48 hours after randomization in the Cangrelor arm were 22% less than in the Clopidogrel arm with the true population effect between 34% and 7%. This result was not statistically significant.
B) The odds of death, myocardial infarction, ischemia-driven revascularization, or stent thrombosis at 48 hours after randomization in the Cangrelor arm were 34% less than in the Clopidogrel arm with the true population effect between 7% and 22%. This result was statistically significant.
C) The odds of death, myocardial infarction, ischemia-driven revascularization, or stent thrombosis at 48 hours after randomization in the Cangrelor arm were 22% less than in the Clopidogrel arm with the true population effect between 34% and 7%. This result was statistically significant.
Summary
This is a very basic introduction to interpreting odds ratios, confidence intervals and p values only and should help healthcare students begin to make sense of published research, which can initially be a daunting prospect. However it should be stressed that any results are only valid if the study was well designed and conducted, which highlights the importance of critical appraisal as a key feature of evidence based medicine.
I do hope you enjoyed working through this and would appreciate any feedback on the content, design and presentational aspects of this tutorial.
Self test Answers
Concept check 1. The correct answer is A.
Concept check 2. The correct answer is B.
Concept check 3. The correct answer is A.
Bringing it all together – Real world example. The correct answer is C.
You may also be interested in these blogs:
Why should students know about kappa value?
Efficacy of drugs: 3 examples to get you to truly understand Number Needed to Treat (NNT)
Key to statistical result interpretation: P-value in plain English
Surrogate endpoints: pitfalls of easier questions
How did they determine diagnostic thresholds: the stories of anemia and diabetes
References:
Bhatt DL, Stone GW, Mahaffey KW, Gibson CM, Steg PG, Hamm CW, Price MJ, Leonardi S, Gallup D, Bramucci E, Radke PW, Widimský P, Tousek F, Tauth J, Spriggs D, McLaurin BT, Angiolillo DJ, Généreux P, Liu T, Prats J, Todd M, Skerjanec S, White HD, Harrington RA. CHAMPION PHOENIX Investigators. (2013). Effect of platelet inhibition with cangrelor during PCI on ischemic events. N Engl J Med. Apr 4;368(14):1303-13.


No Comments on A beginner’s guide to interpreting odds ratios, confidence intervals and p-values
If we say OR is 4 in one group who was exposed to chemotherapy,and in the other group OR is 1.8,this group did not receive chemo.we are looking at the effect of chemo on fertility
2nd June 2016 at 4:15 pmthis was very helpful information, however, seeing as i am a high school student, some of the words were harder for me to understand. maybe you could consider using smaller words so that more people can develop a better understanding!
30th May 2016 at 7:48 amwell, you explained it well and very simply.thank you
25th May 2016 at 11:33 amOdds ratio? Can it be negative?
20th April 2016 at 7:30 pmthanks a lot! it was very helpful for me.
6th April 2016 at 7:01 pmVery easy and simple to understand .Thanks
21st March 2016 at 4:43 amThank you Tim for explaining these concepts! I’m still getting used to what they mean but will be extremely useful in my understanding of tobacco cessation medication research. Great work!
1st March 2016 at 3:51 amThis info given us help full information and given clue on 95%cl and odds. thank you!!!
17th March 2016 at 8:17 amVery simplefied..
2nd January 2016 at 9:16 pmHi Tim,
29th December 2015 at 9:45 pmI’m running a logistic regression & wonder if you could help me? This is not epi data though. In short, I’m wondering how to interpret large ORs (3 and 2) with P-values of var coefficients <.0001 BUT CIs include 1. The explanatory variable is a dummy with 3 levels. Originally, the explanatory variable was continuous but the OR was 1.000. I turned it into a categorical var the ORs increased but CI still includes 1.
This tutorial has been very helpful. Now, i can interpret OR, CI and P value. Thank u so much. God bless u
26th December 2015 at 10:54 pmI’m struggling with my epidemiology and statistics class, your video/youtube tutorials would be so helpful…
15th December 2015 at 6:44 pmHi that’s a really good point and I will see if one of the bloggers would like to make a video tutorial. Podlearn.com may have some videos on statistics
17th December 2015 at 10:10 amHi eka
Have you searched odds ratio, p-value or any data analysis concepts you are struggling with in youtube? There seems to be a lot of attempts at least to teach them.
But if you still find these hard, someone really should figure out how to make these concepts more intuitive…
S4BE tutorial series could be fantastic :)
31st December 2015 at 11:54 pmhello
3rd December 2015 at 11:14 pmdifferent?
odds ratio=0
odds ratio=1
Dear Tim,
21st November 2015 at 8:27 amCan we calculate CI from total number of samples if we do not have the raw data for each individual person?
Hello Tim,
This made clear the CI, P value and odds ratio very quickly compared to a 2 hour uni lecture.
13th November 2015 at 7:44 pmMany thanks,
Emma
Could you explain further that the p value is the estimated probability of rejecting the null hypothesis. I am abit confused
9th November 2015 at 10:30 pmThank you so much…I have read enormous material to understand these concepts and didnt make sense…Really appreciate your info..it makes complete sense now…
22nd October 2015 at 11:09 amBest Regards….
Hi Tim
15th September 2015 at 6:41 amI got he odds value 0.984 for one study and 1.05 for another study, Should I equate it as OR = 1 and say there is no risk, or should I calculate the risk based on the observed values
Hi Tim,
14th September 2015 at 6:55 pmSorry to bother you, but my problem is with sample sizes to different experiments.
For example I’d like to know to calculate the sample size needed to use renal scintigraphy to evaluate glomerular filtration rate in cats with diabetes, I mean which should be the minimum sample of felines (healthy and with disease) to use to establish a baseline gfr?
Best regards
Sergio
Was it, as simple as this? Thank you, you made it!
5th September 2015 at 2:15 pmThanks so much Tim- long time since I did eco stats in 1973. Great help and got 100% – Link In with me and see how Johnson and Johnson will be squirming soon.
30th August 2015 at 11:29 am