Key to statistical result interpretation: P-value in plain English
Posted on 21st March 2016 by Tran Quang Hung

“The p-value is probably the most ubiquitous and at the same time, misunderstood,
misinterpreted, and occasionally miscalculated index in all of biomedical research.”
(Steven Goodman) [1]
Do you feel frustrated when it comes to the meaning of the omnipresent p-value?
If the answer is yes, then bingo, you’ve come to the right place, because the meaning of p-value is what this post is all about.
How did Kobe Bryant help me understand the p-value?
Imagine that one day, Kobe Bryant (the famous basketball player) got into a 1 on 1 match with a, say, ten-year-old kid. Piece of cake for Kobe, right?
But it turned out that Kobe lost the game.
Whatttttttttt?
Kobe was beaten in a 1 on 1 match against a little kid! Fans were shocked. And frustrated. And angry.
The reasoning goes like this: if Kobe had played as usual, he would have been highly unlikely to be defeated. But he lost the game! So fans had every reason to cast doubt on his fair play. (I’m so sorry, Kobe).

gettyimages.com
To put it another way, the reasoning goes like this: We have a hypothesis: Kobe rocks as usual. If the hypothesis had been true, the probability of him losing would have been soooooooo small, say, less than 5%. But he lost the game. So the unlikelihood was considered as evidence against his fair play.
In medical studies, the authors do almost the same thing. They propose a hypothesis (the full name is null hypothesis), which is “a statement suggesting that nothing interesting is going on, for example, that there is no difference between the observed data and what was expected, or no difference between two groups.” [2] Then the authors calculate the probability (p-value) of the collected data, given that the null hypothesis was true. If the p-value is too small, they have every reason to cast doubt on the accuracy of the null hypothesis. Then, they reject the null hypothesis, and accept the “inverse hypothesis” (alternative hypothesis).
See?
The p-value reflects the strength of evidence against the null hypothesis. Accordingly, we’ll encounter two situations: the strength is strong enough or not strong enough to reject the null hypothesis.
How do we determine whether a p-value is strong enough or not?
Generally, we use 0.05 as a threshold. If p > 0.05, we say that the evidence against the null hypothesis is not strong enough, and we can’t reject the null hypothesis. If p < 0.05, we say that the evidence against the null hypothesis is strong enough, so we reject the null hypothesis and accept the alternative hypothesis.
Let’s get back to the academic definition
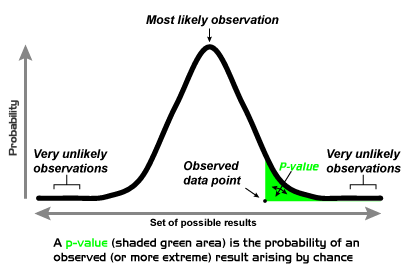
In academic literature, the p-value is defined as the probability that the data would be at least as extreme as those observed, if the null hypothesis were true. (Actually, I was stunned when first saw this definition. Just don’t tell anyone else. That’s a secret.)
“at least as extreme as those observed”? What do the statisticians mean by saying that?
To answer that question, let’s do an experiment with a coin.
A friend of mine showed me a mundane coin and insisted that it was not a normal one. I did not believe in his boast, so I decided to conduct an experiment with that coin. My null hypothesis was: “The coin is normal like any other one”. Then I tossed the coin 20 times. I got 18 heads and 2 tails
Normally, when tossing a coin, I expect the result of 10 heads + 10 tails to be the most frequent, followed by the results of 9 heads + 11 tails and 11 heads + 9 tails. The result of 18 heads + 2 tails goes to the periphery of the probability curve (that is, more extreme). The p-value is the probability of the observed outcome plus all “more extreme” outcomes (in this case: 19 heads + 1 tail and 20 heads + 0 tail), represented by the shaded “tail area” [1]. Often, statisticians calculate a two-tail p-value (I’ll explain the reason in another post), so 18 tails + 2 heads, 19 tails + 1 heads and 20 tails + 0 head are included.
https://upload.wikimedia.org/wikipedia/en/0/00/P-value_Graph.png
P-value = probability that the data would be at least as extreme as those observed = p (18 heads and 2 tails) + p (19 heads and 1 tails) + p (20 heads and 0 tail) + p (18 tails + 2 heads) + p (19 tails + 1 heads) + p (20 tails + 0 head) = 0.0004 (*)
The chance of obtaining such a result is so small, if the coin were normal. So I reject the null hypothesis, and accept that the coin is extraordinary. Well, indeed, an extraordinary coin.
A friend of mine had an amazing coin. He just gave me that coin yesterday. Just don’t tell anyone else. That’s a secret.
REFERENCES
1/ Goodman S. A dirty dozen: Twelve p-value misconceptions. Semin Hematol. 2008; 45:135–140. http://www.perfendo.org/docs/BayesProbability/twelvePvaluemisconceptions.pdf
2/ Andrew J. Vickers. What is a p-value anyway? 34 Stories to Help You Actually Understand Statistics. Boston: Pearson Education, 2009. 1st edition.
(*): p (18 heads 2 tails) = p (18 tails 2 heads) = 0.5^20 x 20C2
p (19 heads 1 tail) = p (19 tails 1 head) = 0.5^20 x 20C1
p (20 heads 1 tail) = p (20 tails 1 head) = 0.5^20 x 20C0
=> p-value = (0.5^20 x 20C2 + 0.5^20 x 20C1 + 0.5^20 x 20C0) x 2 = 0.0004
Read more of Tran’s blogs here…
Efficacy of drugs: 3 examples to get you to truly understand Number Needed to Treat (NNT)
How did they determine diagnostic thresholds: the stories of anemia and diabetes
Surrogate endpoints: pitfalls of easier questions
Why should medical students know about kappa value?


No Comments on Key to statistical result interpretation: P-value in plain English
HI Tran
followed your fantastic explanation without difficulty until you mentioned C0, C1, C2 etc in the *p value equation. Would you please identify these notations and indicate the value?
thanks a lot!
14th September 2020 at 2:04 amwhat is c2, c1 c0?
23rd July 2019 at 1:46 pmthank you so much this was so useful and really helped me to get my head round it :)
2nd June 2019 at 7:09 pmGood example(s) except that Kobe sucks ;)
20th October 2018 at 7:38 amI tried to look for series of simple explanations to clearly understand about the P-value interpretation.Every time I tried, I used to feel as if I understood it but,when I close my eyes and start to internalize it I find myself inapt, but not after I went through this explanation. Thank you so much, extraordinarily, you put your feet in my shoes.
1st February 2018 at 12:01 amHere is a non mathematical explanation of the p value:
8th January 2017 at 3:02 pmhttp://www.exercisebiology.com/index.php/site/articles/what_is_a_p_value/
Thank you for posting such valuable information. I’m beginning to grasp the concept of confounders and I realize that is of capital importance. Keep it simple, I enjoyed reading yous post.
24th March 2016 at 5:04 amI hope you took into account all the factors involving tossing a coin, such as; initial position, if you grab it with your dominant hand and then flip it, wind if applicable, and so on. The conditions should be the same every time and blah blah blah. Jajaja nice work, I understand P value a little bit better now. Keep the good work.
23rd March 2016 at 5:17 amSo true, Eduardo. We should take into account all the confounding factors of the coin flipping result. And I did, in the first draft of this post. Then I cut them out for simplicity’s sake :D
23rd March 2016 at 9:25 am