A beginner’s guide to confounding
Posted on 1st October 2018 by Eveliina Ilola

Confounding means the distortion of the association between the independent and dependent variables because a third variable is independently associated with both.
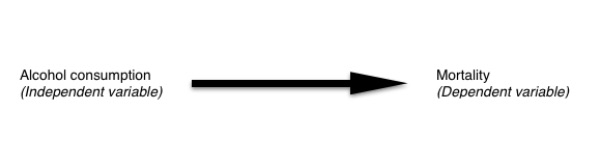
A causal relationship between two variables is often described as the way in which the independent variable affects the dependent variable. The independent variable can take different values independently, and the dependent variable varies according to the value of the independent variable.
So, let’s say you want to find out how alcohol consumption affects mortality…
You decide to compare the mortality rates between two groups – one consisting of heavy users of alcohol, one consisting of teetotallers. In this case alcohol consumption would be your independent variable and mortality would be your dependent variable.
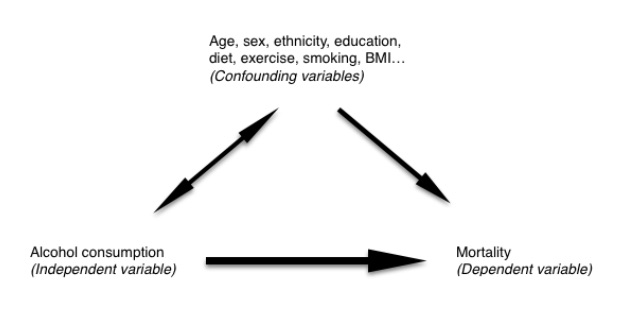
If you find that people who consume more alcohol are more likely to die, it might seem intuitive to conclude that alcohol use increases the risk of death. In reality, however, the situation might be more complex. It is possible that alcohol use is not the only mortality-affecting factor that differs between the two groups.
People who consume less alcohol might be more likely to eat a healthier diet or less likely to smoke, for example. Eating a healthy diet or smoking might in turn affect mortality. These other influencing factors are called confounding variables. If you ignore them and assume that any differences in mortality must be caused by a difference in alcohol consumption, you could end up with results that don’t reflect reality all that well. You might find associations where in reality there are none, or fail to find associations where they do in fact exist.
How to minimise the effects of confounding during study design
If you are investigating the effects of an intervention, you can randomly assign people to an intervention and control group. The aim of randomization is to evenly distribute the known and the unknown confounders between the two groups. The groups might still differ in potential confounders by chance but randomization minimises these differences.
In other types of studies you can address confounding through restriction or matching. Restriction means only studying people who are similar in terms of a confounding variable – for example, if you think age is a confounding variable you might only choose to study people older than 65. (This would obviously limit the applicability of your results to other groups). Matching means pairing people in the two groups based on potential confounders.
How to minimise the effects of confounding during statistical analysis
After completing the study you can minimise the effects of confounding using statistical methods.
If there is only a small number of potential confounders you can use stratification. In stratification you produce smaller groups in which the confounding variables don’t vary and then examine the relationship between the independent and dependent variable in each group. In the example we used before, for example, you might want to divide the sample into groups of smokers and non-smokers and examine the relationship between alcohol use and mortality within each.
If there is a larger number of potential confounders you can use multivariate analysis, for example logistic or linear regression.
Conclusions
The association between two variables might be modified by a third variable, and this can lead to distorted results. Even after taking this into account in study design and data analysis your data could still be distorted by confounding – there might e.g. be other confounding factors you don’t know of – but the first steps in reducing its effects are being aware of its potential to distort your results and planning accordingly.
Sources:
Pourhoseingholi, M. A., Baghestani, A. R., & Vahedi, M. (2012). How to control confounding effects by statistical analysis. Gastroenterology and Hepatology From Bed to Bench, 5(2), 79-83.
Catalogue of bias collaboration, Aronson JK, Bankhead C, Nunan D. Confounding. In Catalogue Of Biases. 2018. https://catalogofbias.org/biases/confounding/


No Comments on A beginner’s guide to confounding
Simplified, comprehensive.
17th July 2021 at 4:51 pmGreat piece
9th October 2018 at 6:45 pmSimple