What is data dredging?
Posted on 25th June 2021 by Vighnesh D

What is data dredging? How does it affect the p-value? What is its impact on the world around us?
The following discussion will attempt to define data dredging and provide an answer to such questions.
Contents
- Introduction
- Significance of p-value
- Impact of data dredging on epidemiology
- Conclusion
- References
Introduction
Data dredging is defined as “cherry-picking of promising findings leading to a spurious excess of statistically significant results in published or unpublished literature”. This may lead to an exponential increase in the risk of inclusion of large quantities of false positive results, thereby corrupting the data that was meant to be originally reported. Data dredging is recognized by several names such as ‘fishing trip’, ‘data snooping’, ‘p-hacking’ and so on. We may use these term interchangeably in the discussion below.
The predominant reason for this practice is the widespread notion among academics that “statistically significant data is noteworthy, and one that is not statistically significant is not”. A significant part of the statistical estimate is based on the assumption that the correct statistical model is estimated. Part of the reason for this is also because the difference between inferential and descriptive use of statistics is often blurred, and could be mistaken by novice epidemiologists. Therefore, it should be understood that statistical inference only tells us about the range of the truth within the data that has been observed.
Ioannidis (2005) explains that ‘negative’ research is useful and, in fact, it is a misnomer to classify it as negative. Another instance that is closely associated with this phenomenon is the recent trend of multicentre studies. Ioannidis further explains that “What is less well appreciated is that bias and the extent of repeated independent testing by different teams of investigators around the globe may further distort this picture and may lead to even smaller probabilities of the research findings being indeed true.” Therefore, it is prudent to understand that interpretation of research and the data obtained from it is as important as classifying it as ‘positive’ or ‘negative’.
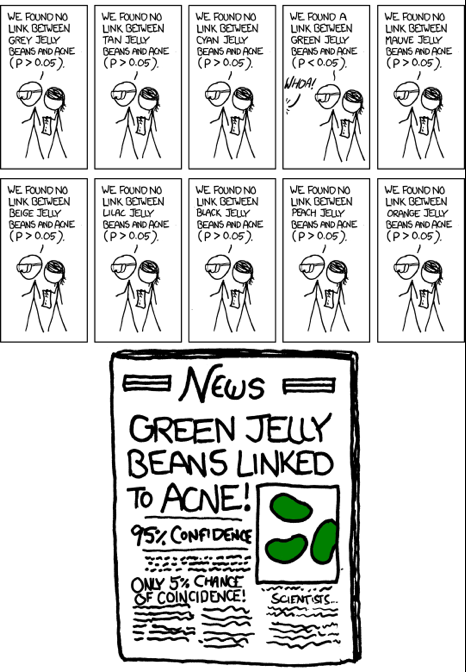
Image has been adapted from: https://imgs.xkcd.com/comics/significant.png under Creative Commons License 2.5 Randall Munroe. xkcd.com.
Significance of p-value
According to the American Statistical Association (ASA), a p-value is defined as:
the probability under a specified statistical model that a statistical summary of the data (e.g., the sample mean difference between two compared groups) would be equal to or more extreme than its observed value.
A p-value less than or equal to 0.05 is generally accepted as statistically significant. This is an indication of strong evidence against the null hypothesis. This threshold is often exploited in academia in order to publish data as ‘statistically significant’. In order to gather significant data, investigators often unconsciously make the mistake of picking up data suitable to their hypothesis.
So, in order to put things into perspective, the ASA proposed certain principles regarding p-values to improve their conduct. They are as follows:
- P-values can indicate how incompatible the data are with a specified statistical model
- P-values do not measure the probability that the studied hypothesis is true, or the probability that the data were produced by random chance alone.
- Scientific conclusions and business or policy decisions should not be based only on whether a p-value passes a specific threshold
- Proper inference requires full reporting and transparency (P-values and related analyses should not be reported selectively)
- A p-value, or statistical significance, does not measure the size of an effect or the importance of a result
- By itself, a p-value does not provide a good measure of evidence regarding a model or hypothesis
Now that we have established that p-values are not the one-stop solution for epidemiological studies, let’s take a look at other methods which are used for the same purpose:
- Confidence Interval
- Decision theoretic modelling
- Likelihood ratios
- Bayesian Factors
These measures rely on addressing the size of an effect and the validity of a hypothesis directly. However, since they rely on an assumption, they are to be considered as a complement to p-values instead of its substitute.
Impact of data dredging on epidemiology
Data dredging affects a study in several ways (almost always in a negative manner), which ultimately hampers the study, often without the knowledge of the investigator. A small amount of confounding is probably inevitable. However, voluntary application of such a practice is not only unethical but also leads to misleading the general public. Some of the common effects of data dredging are as follows:
- Increases the number of false positives
- May lead to retraction of publications
- Mislead other investigators
- May lead to cessation of funding
- Increased bias of the study
- Decreased range of probability
- Wastage of resources
Conclusion
P-hacking is a widespread practice amongst the scientific community. Such a practice is unethical and a gross waste of resources. However, it can be restricted if one follows proper guidelines for conducting a study. More importantly, such a phenomenon is a reminder to all the investigators that it is more important to study the pitfalls of research before venturing into conducting one. That is not to say that one should spend a significant time of research in avoiding voluntary errors, but to say that one must be conscious regarding it.
References (pdf)
You may also be interested in the following blogs for further reading:
Key to statistical result interpretation: P-value in plain English
A beginner’s guide to interpreting odds ratios, confidence intervals and p-values
A beginner’s guide to confounding
Don’t confuse “statistical significance” with “importance”