Economic analysis part 2: types of economic evaluation
Posted on 25th October 2021 by Ana María Rojas Gómez

This is the second in a three-part blog which will provide explanation and examples of the most common techniques used in economic evaluation. Part one was an introduction to economic analysis and part three will look at a few aspects of the topic in more detail.
Cost-effectiveness analysis (CEA)
CEA is usually used when a decision-maker considers a limited range of options. This analysis consists mainly of dividing the cost of an alternative in monetary units by health outcomes such as lives saved, strokes averted, or reduction in blood pressure. Although you will be comparing different interventions in this analysis, the health outcome used must be the same across all interventions.
The results of this type of analysis would be presented as: “$37 000 per life-year saved” or “$15 000 per broken hip cases averted”.
If a new treatment has lower costs and higher effectiveness, we can indicate that it is ‘dominant’. By contrast, if a treatment has higher costs and lower effectiveness, we can indicate that it is ‘dominated’.
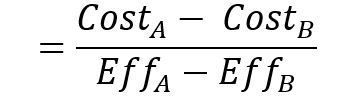
In the case of non-dominant or dominated treatments, an incremental cost-effectiveness ratio (ICER) must be calculated, using the following formula:
Cost-utility analysis (CUA)
CUA is a cost-effectiveness analysis type that compares cost in monetary units with patient-centred outcome measures, in respect of their utilities. A ‘utility’ is a measure of the benefit obtained from the treatment/intervention. (1).
In fact, the measure generally used for this type of analysis is the quality-adjusted life year (QALY). QALY is an index adjusted to account for the patient’s quality of life during the time evaluated. For example, if a patient lives in perfect health for 1 year, that patient will have 1 QALY (2). QALY is calculated by multiplying the life years by the quality life score bases (QOL). A QOL score is based on a one-dimensional scale like the EQ-5D (EuroQol 5 dimension) questionnaire. QOL will range between 0 for death, to 1 for perfect health, with negative scores being allowed for states considered ‘worse than death’ (3).
The use of QALY enables us to compare the cost-effectiveness of interventions used for several diseases and, therefore, it’s useful for including new technology in a healthcare plan (4).
For example, if a patient survives for 3 years under a health status with an EQ-5D = 0.8, the calculation is as follows: 0.8 (ED-5D) × 3 (Life years) = 2.4. Therefore, this is the equivalent to a 2.4-year survival under full health.
A cost-utility ratio is calculated using the following formula:
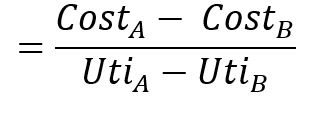
The results of cost-utility analysis are usually written as “$ per QALY gained”.
Cost-benefit analysis (CBA)
CBA compares the costs and benefits of two interventions quantified in common monetary units. It requires that benefits such as life-years gained, disability days avoided, or medical complications avoided, be represented in a monetary value that could be interpreted with the costs. It may also be useful when we want to determine whether health investment reduces costs. For example, a 2018 study examined whether a Colombian insurer’s investment in preventive programs can reduce work‐related injuries and costs associated (5). Therefore, they conducted a cost-benefit analysis of investments in preventive measures from the insurer’s perspective.
Data was based on a group of companies affiliated with a private insurer in Bogota, Colombia. Parameters evaluated included the number of employees, level of labour risk, type of sector, and information related to the insurer’s investments in prevention at the company for each month. Researchers also included data related to injuries at work, medical costs, sick-leave costs, legal costs, and insurance compensation. All variables were represented as monetary units for analysis.
Results showed a positive relationship between investments and occupational injury reduction. They found a cost-benefit ratio of 1.3 from the insurer’s perspective. As we can see, in this type of cost-benefit analysis ratio, the formula is represented as:
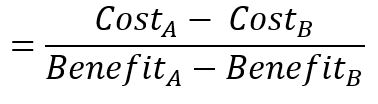
The results are usually written as “Cost-benefit ratio of 2”.
On the other hand, if you want to calculate a cost-benefit ratio, the following formula must be used:
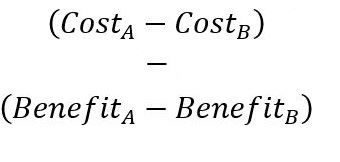
In turn, results of net benefit in cost-benefit are usually written as “Net cost of $35 000”.
Cost minimization analysis (CMA)
Lastly, there is a type of health evaluation rarely used: Cost-minimization analysis (CMA). This evaluation has an assumption that the results of two or more health interventions are equivalent, so the difference between them becomes a cost comparison. Commonly, it is used when there is an evidence-based decision history where we know that the outcomes are similar, but the basis remains questionable (6). The analysis tends to be justifiable when we evaluate therapies with similar technologies. Therefore, the results of the cost-minimization analysis are usually presented as “Intervention A is less expensive than intervention B”.
You may also find this short video useful: Health Economic Evaluation – simplified!