Using Measures of Variability to Inspect Homogeneity of a Sample: Part 2
Posted on 24th February 2022 by Tarik Suljic
In the first part of this two-part blog, we covered range, standard deviation, and variance – measures of variability that have units assigned to them. In this blog, we will cover coefficients – measures of variability that do not have units assigned to them. The advantage of that is that they represent a standardisation measure so that they can be compared between different groups and, as we will see, different values.
In this blog you will learn about:
- How to compare variabilities of two variables – Coefficient of variation;
- How to compare yourself (or a value) to others (the mean) – Z-score
Coefficient of variation
We have shown that variance is a geometrical type of variability measure and the standard deviation is its linear form. However, both variance and standard deviation (SD) bear a unit with them. What if we would like to compare variabilities of two variables, let’s say height and weight, in the same group of participants; how could we do that considering that they have different units of measurement?
For those purposes we use coefficients, which usually divide two numbers so that their units cancel out, thus enabling us to compare one coefficient with another. In this way, the coefficient of variation serves as a standardisation measure that enables us to compare two measurements and assess their variability in respect to their means.
Let’s imagine there is a group of participants whose height and weight were taken for analysis, and summarised in the table below:
| Variable | Height | Weight |
| Standard deviation | ± 3.8cm | ± 23.2kg |
| Average | 178cm | 73kg |
We can see that the group have a narrow spread of height, with a greater spread of weight, but we still cannot compare them.
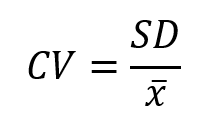
To be able to compare them, we use the coefficient of variation (CV). CV is a quotient between standard deviation and average.
By updating the table, we find that the CV is greater for weight than it is for height, demonstrating that individuals in the sample had greater variability in weight rather than height.
| Variable | Height | Weight |
| Standard deviation | ± 3.8cm | ± 23.2kg |
| Average | 178cm | 73kg |
| CV | ± 0.21 | ± 0.31 |
Z-score
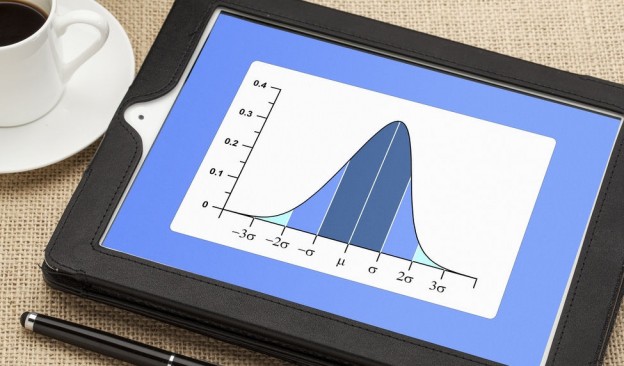
A Z-score tells us how far a value differs from the mean. According to the formula shown below, the z-score does not have any assigned units. However, it is generally said that a value is n-standard-deviations away from the mean.
Let’s imagine that each student from your class, consisting of 20 students, has an oral presentation about one particular topic. The class lasts for 40 minutes, so each student has 2 minutes at their disposal to deliver a presentation. You have been frequently accused of prolonging your presentations, so you decide to use your statistical knowledge, which others may lack, to prove to them that you delivered today’s presentation close to the average time of the class.
You take your stopwatch, and time (in seconds) the presentations of each individual in class, including yourself. When you arrive home, you calculate the average and SD for the whole class.
You find out that your presentation lasted for 180 seconds, whilst the class average was 134.55 seconds, and the SD is 48.46 seconds. To calculate where you are in relation to others, you use the following formula in which you apply the data:
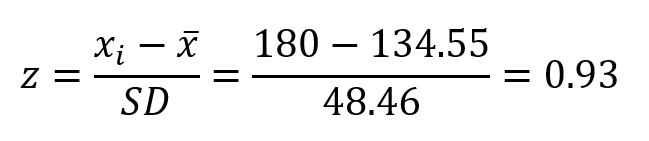
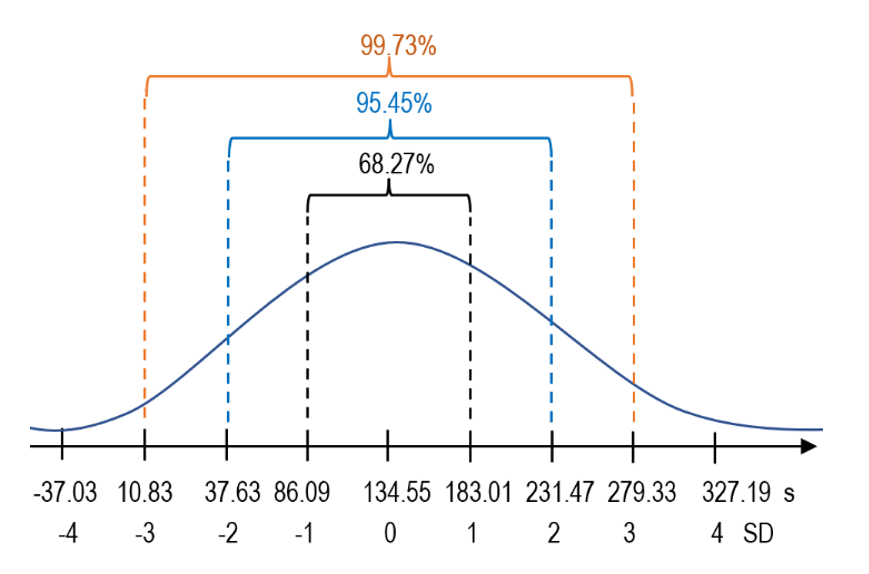
So, you find out that your z-score is 0.93SD from the average, which is close to the average and is in the area under the bell curve for which is considered that ~68% of the sample data occurs.
Eventually, you get interested in how deviant your greatest critics were when it comes to the duration of their presentations, and you start filling in the following table. This is your chance to calculate the z-scores yourself:
| No | Time (s) | Z-score |
| 1 | 110 | ? |
| 2 | 140 | ? |
| 3 | 195 | ? |
| 4 | 175 | ? |
| 5 | 152 | ? |
Finally, you can check your calculations for the Z-score exercise in this document (pdf).