Tutorial about Hazard Ratios
Posted on 5th April 2016 by Loai Albarqouni

You have been asked to run a journal club in your department about heart failure. You followed the key steps of Evidence-Based Practice that you have learned: formulated a clear searchable clinical question, searched the main databases and came across this recent hypothetical article.
In this hypothetical article, the authors conducted a randomised controlled trial to investigate the effectiveness of a new treatment for improving the survival of patients with heart failure. A total of 105 patients were randomised to the treatment group and a total of 106 were randomised to the control group. The primary outcome was the overall survival rate.
The main result of this trial can be summarised in this paragraph: “After a median follow-up of 1500 days, the hazard ratio for death in the treatment group, 0.38; 95% confidence interval [CI], 0.28 to 0.53; P<0.0001).”
In addition, the authors presented the figure below summarizing their main results:
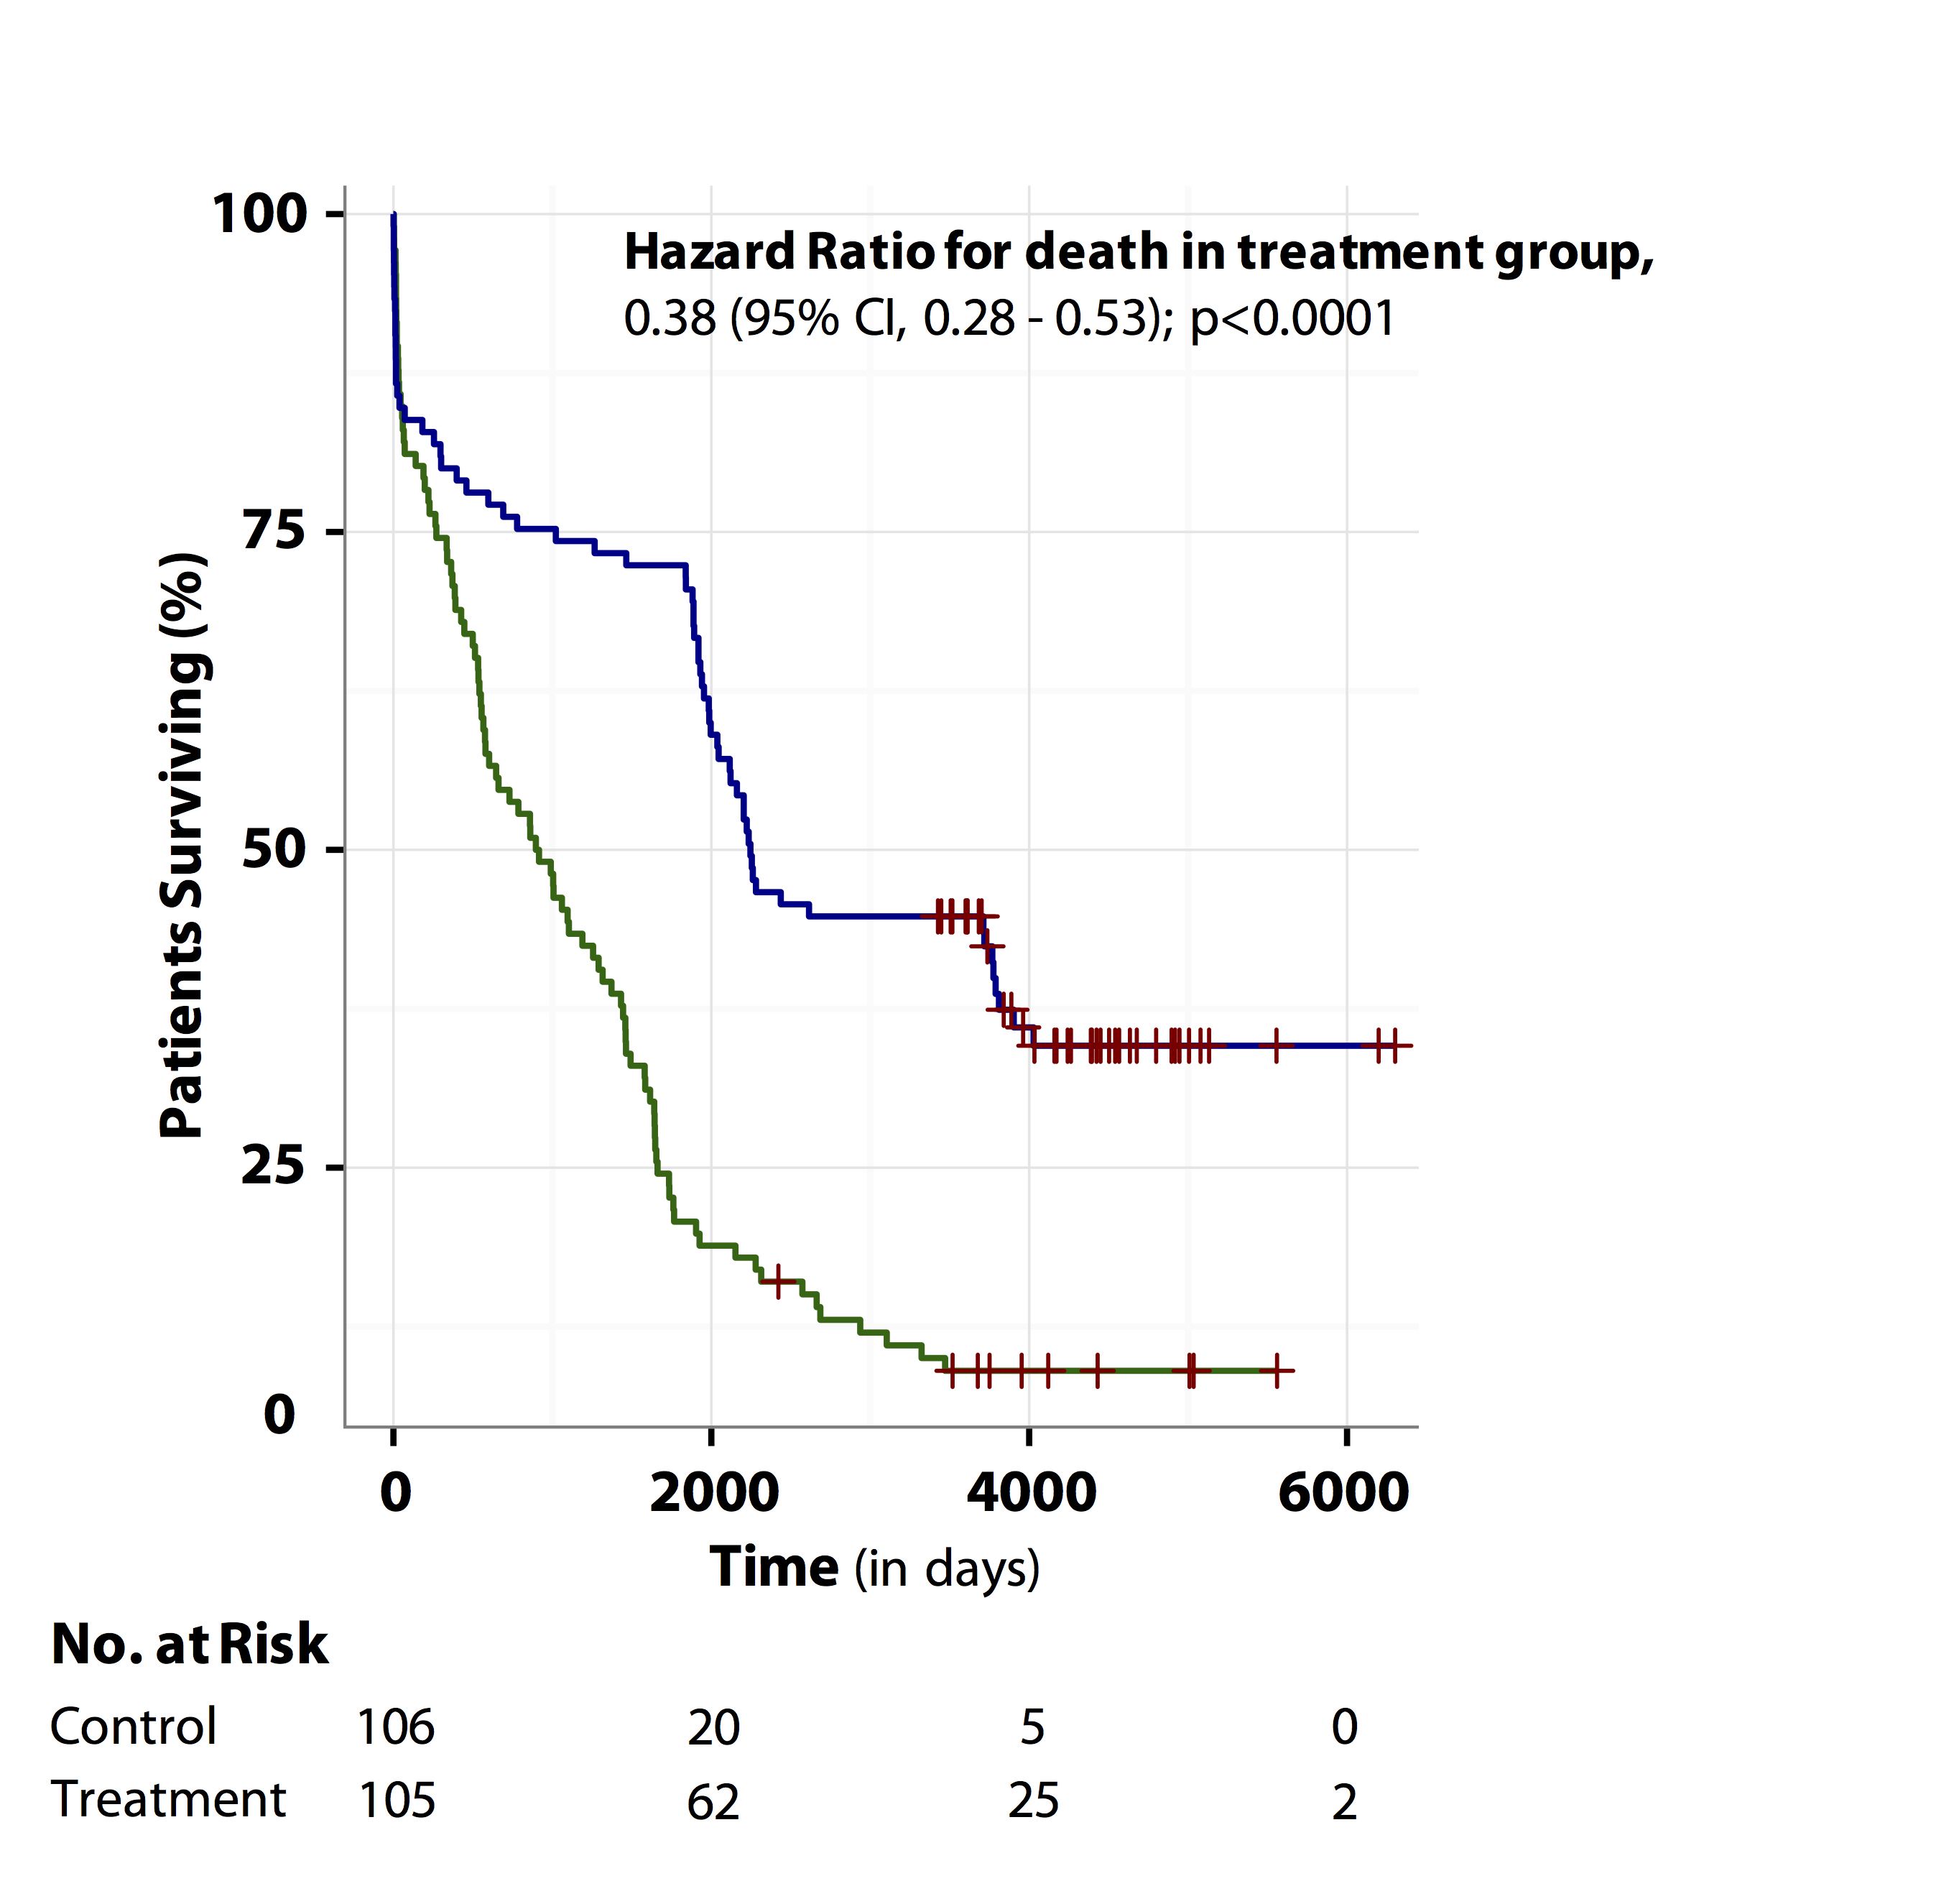
Figure produced by the author using R software
(Blue line represents treatment group and green line represents control group).
You want to critically appraise the article. However, you have some difficulty understanding its main results and have a few questions:
- What is Hazard Ratio? What do the authors mean by 95% confidence interval? How can you interpret this information?
- How can I read the figure? What are the main findings I can learn from this figure?
- How can I convey this information to my patients?
In this blog, you may find the answers to these questions.
What is a Hazard Ratio & what are Confidence Intervals?
Hazard ratio (HR) is a measure of an effect of an intervention on an outcome of interest over time. Hazard ratio is reported most commonly in time-to-event analysis or survival analysis (i.e. when we are interested in knowing how long it takes for a particular event/outcome to occur).
The outcome could be an adverse/negative outcome (e.g. time from treatment/surgery until death/relapse) or a positive outcome (e.g. time to cure/discharge/conceive/heal or disease-free survival).
Hazard Ratio (i.e. the ratio of hazards) = Hazard in the intervention group ÷ Hazard in the control group
Hazard represents the instantaneous event rate, which means the probability that an individual would experience an event (e.g. death/relapse) at a particular given point in time after the intervention, assuming that this individual has survived to that particular point of time without experiencing any event.
Confidence Interval (CI): is the range of values that is likely to include the true population value and is used to measure the precision of the study’s estimate (in this case, the precision of the Hazard Ratio). The narrower the confidence interval, the more precise the estimate. (Precision will be affected by the study’s sample size). If the confidence interval includes 1, then the hazard ratio is not significant.
Interpretation of Hazard Ratio
Because Hazard Ratio is a ratio, then when:
HR = 0.5: at any particular time, half as many patients in the treatment group are experiencing an event compared to the control group.
HR = 1: at any particular time, event rates are the same in both groups,
HR = 2: at any particular time, twice as many patients in the treatment group are experiencing an event compared to the control group.
Applying this to our hypothetical study results:
In the results, the authors reported that the hazard ratio for death with the new treatment = 0.38 (95% CI, 0.28-0.53; P<0.0001). What does that mean?
Patients in the new treatment group at any time point during the study period were 62% less likely to die than patients in the control group, and we are 95% confident that the true value is lying between 47%-72%. (i.e. we are 95% sure that patients in the new treatment group were between 47% and 72% less likely to die than patients in the control group).
Kaplan-Meier curve (or Survival curve)
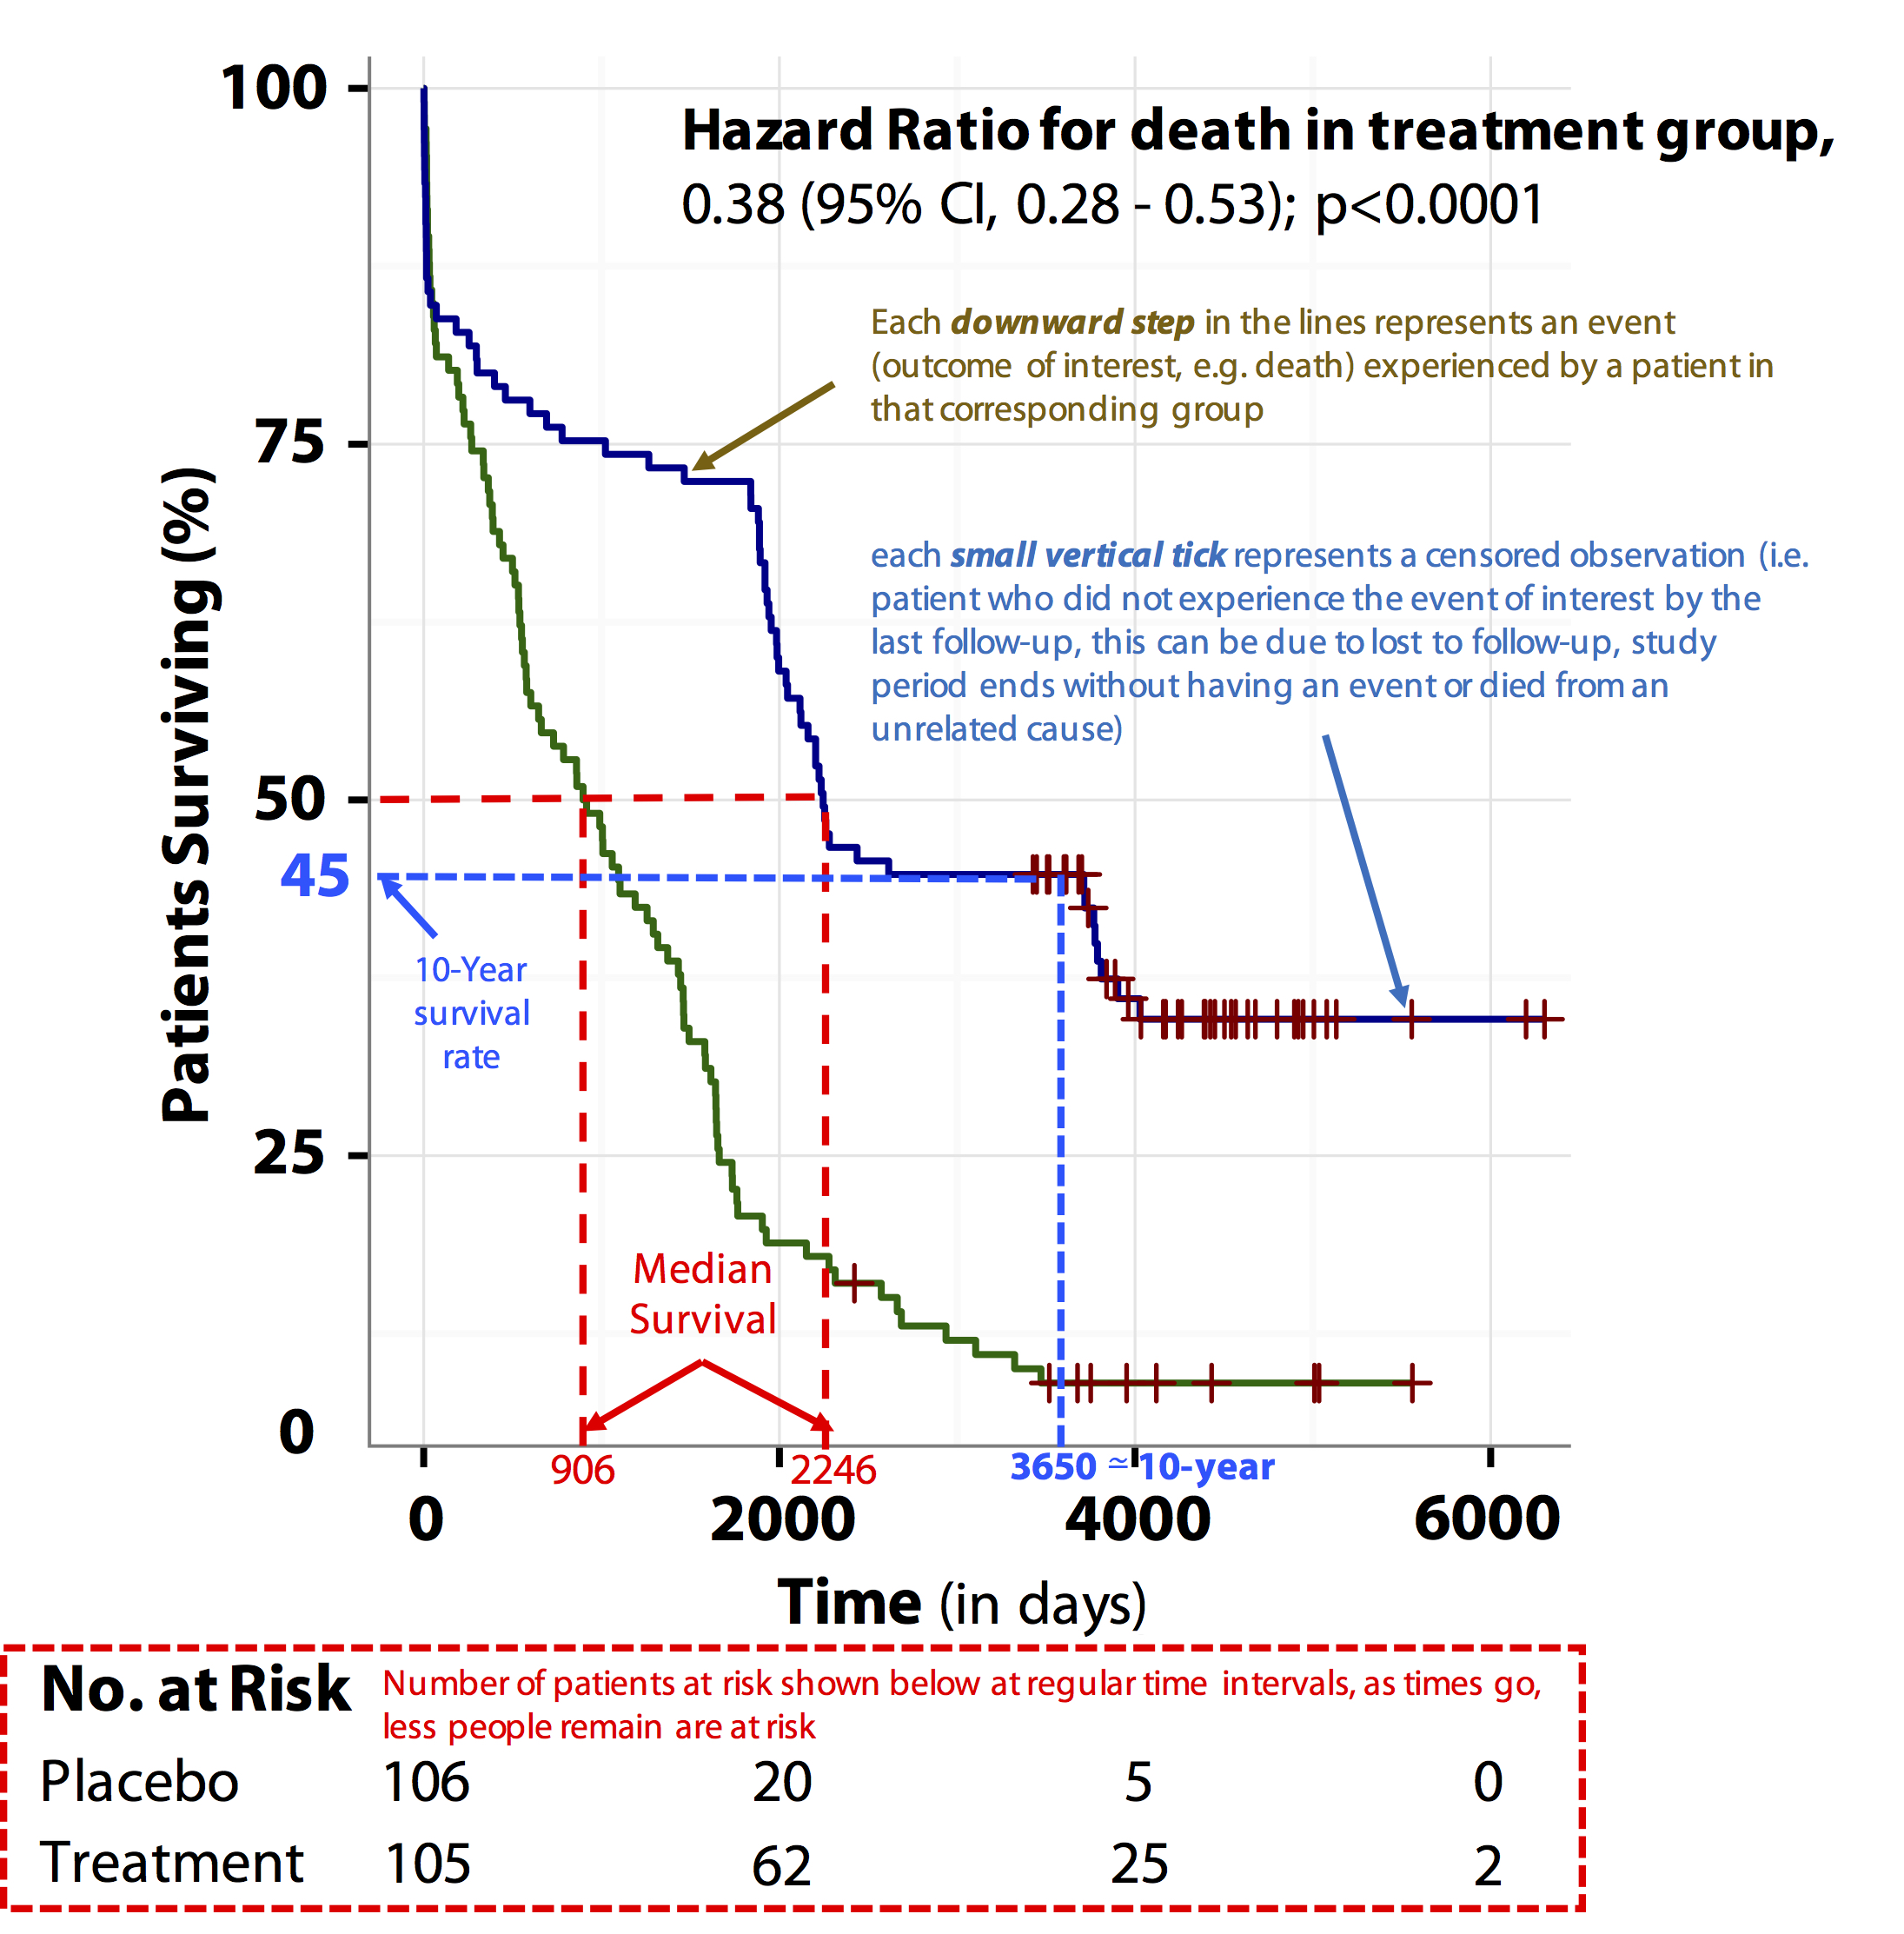
Figure produced by the author using R software
(Blue line represents treatment group and green line represents control group).
Kaplan-Meier curve: is a graphical method of displaying survival data or time-to-event analysis (i.e. the proportion of patents surviving against time) and is usually drawn as a step function.
- The horizontal axis represents the time of follow-up starting from enrolment while the vertical axis represents the estimated probability of survival.
- Each downward step in the lines represents an event (the outcome of interest, e.g. death) experienced by a patient in that corresponding group, while each small vertical tick represents a censored observation (i.e. a patient who did not experience the event of interest by the last follow-up. This can be due to being lost to follow-up, the study period ending without an event or because the patient died from an unrelated cause).
- The numbers of patients at risk at regular time intervals is shown at the bottom of the figure. With time, fewer people remaining are at risk.
- This graph also allows you to detect the progression of the condition (e.g. early postoperative mortality or a serious adverse event caused by the drug), by the presence of a notable sudden steep drop in survival at a particular time point.
Interpretation of this figure
The results of this graph can be communicated in various ways:
- Median survival: half of the patients in the treatment group have survived for 2246 days (median survival rate) compared to 906 days in the control group.
- Difference in median survival: On average, patients in the intervention group survived for 1340 days longer than patients in the control group (2246 – 906 days).
- Proportion surviving at a specific time point: about 45% of patients in the treatment group have survived for 10 years (3650 days, i.e. 10-year survival rate). Another way of saying this is that about 45% of the patients in the treatment group have not experienced the outcome of interest (e.g. death) after 10 years of follow-up.
Hazard Ratios vs. Risk Ratios (or Relative Risk)
Hazard ratio is frequently interpreted as risk ratio (or relative risk), but they are not technically the same. However, if that helps you to understand hazard ratio then it is OK. But keep in mind HR is not RR.
One of the main differences between risk ratio and hazard ratio is that risk ratio does not care about the timing of the event but only about the occurrence of the event by the end of the study (i.e. whether they occurred or not: the total number of events by the end of the study period). In contrast, hazard ratio takes account not only of the total number of events, but also of the timing of each event.
References & Further Reading
- Altman D.G., Bland J.M. Time to event (survival) data. BMJ 1998; 317:468
- Bland J.M., Altman D.G. Survival probabilities (the Kaplan-Meier method). BMJ 1998;317:1572
- Spruance S.L., Reid J.E., Grace M., Samore M. Hazard ratio in clinical trials. Antimicrob Agents Chemother 2004; 48: 2787–2792.
- Sedgwick P. How to read a Kaplan-Meier survival plot. BMJ 2014; 349: g5608
- Sedgwick P. Hazards and hazard ratios. BMJ 2012; 345: e5980


No Comments on Tutorial about Hazard Ratios
Very well explained and easy to understand, truly helpful. Thanks!!
8th August 2023 at 11:03 amA big thank you . very helpfu article
12th July 2023 at 10:49 amCann’t thank you enough man!!! So clear, simple and hands-on. Definitely makes life easier!!!
21st June 2023 at 2:04 amI found this article very useful in improving my understanding of risk, odds, and hazard ratios. These terms are quite often used interchangeably in different studies. The author clearly defined that the hazard ratio considers both the total number of events as well as the occurrence of events at different times in two groups (intervention and non-intervention).
15th June 2023 at 7:53 amThe survival curve was also explained in a very clear and comprehensive manner.
A big thank you!!
12th February 2023 at 1:24 pmThis is the best input available on the net to simply understand survival analysis
12th January 2023 at 1:05 pmThank you!
8th October 2022 at 11:02 pmInformative and simple.
You say that the hazard ratio and relative risk are not the same. Can you provide an example of that?
Since proportionality is assumed to report 1 hazard ratio, wouldn’t that just end up being the relative risk since we’re assuming the hazard rate doesn’t change, i.e. the survival curve is linear.
Let me give a simplified example:
Let’s say the survival curve for the treatment arm follows the equation= -X+100
Let’s say the survival curve for the control arm follows the equation= -2X+100
AT t=30, 70 survive in the treatment arm, which means a 30% risk of death.
AT t=30, 40 survive in the control arm, which means a 60% risk of death.
RR=.5
in this simplified example, the hazard ratio is .5, but so is the RR?
What are the real life nuances that make this relationship not valid.
8th July 2022 at 10:37 amVery very helpful article. So easily explained: many thanks for your input
30th June 2022 at 5:47 pmSeriously, this has been very helpful. I am retaking the course and this is the first time Iv understood. You are a star. Thank you!
25th June 2022 at 3:01 pmHi Lori,
Not being in the medical of mathematics fields, can you put these figures in layman’s terms terms for me?
“Among the men, the relative hazard of death from coronary heart disease when one’s twin died of coronary heart disease before the age of 55 years, as compared with the hazard when one’s twin did not die before 55, was 8.1 (95 percent confidence interval, 2.7 to 24.5)”
Thank you very much.
Daniel
Source: https://www.nejm.org/doi/full/10.1056/nejm199404143301503
4th October 2021 at 4:43 pmHi Loai,
I found your explanation really helpful. I however could not understand the No. at risk section. Does it mean as time goes by less number of individuals are at risk of death because they have died? Does it mean the remaining living people at that point in time? If so it still doesn’t correspond to the figures if we see the 6000 days readings. For treatment group, survival is nearly 35% as per the graph, but the no. at risk shows 2 patients. If we go by 35% of 105, it should mean 37 patients are still alive at 6000 days. I would be really grateful if you could clarify.
Thanks
24th September 2021 at 4:36 pmThis page has helped me to understand these basic concepts than 2 semesters of Statistics course :) I salute you Loai, many thanks!
8th April 2021 at 9:05 amI really appreciate this. Just dropping a message to say Thank You!!!
28th November 2020 at 12:48 pmHello Loai,
I am a masters student in nursing and very new to research , hence doing as many tutorials as i can. This is one of the best i have seen. Thank you. I am still learning and was hoping you could elaborate on the confidence interval and your comment above regarding if the confidence interval includes one then the HR is not significant? thank you . any further recommendations for tutorials would be welcome as well.
19th August 2020 at 6:48 amNice presentation, but a bit abriged. Suggest more examples
23rd July 2020 at 8:22 pmhow did you get 47% – 72% from a CI of .28-.53?
27th May 2020 at 4:24 pmthank you for this simplicity
20th May 2020 at 1:14 pmI wish I have seen this website before :(
5th May 2020 at 10:53 pmIt was excellent. Very comprehensive! Thanks and congratulations!
4th April 2020 at 11:30 am