A beginner’s guide to standard deviation and standard error
Posted on 26th September 2018 by Eveliina Ilola
What is standard deviation?
Standard deviation tells you how spread out the data is. It is a measure of how far each observed value is from the mean. In any distribution, about 95% of values will be within 2 standard deviations of the mean.

How to calculate standard deviation
Standard deviation is rarely calculated by hand. It can, however, be done using the formula below, where x represents a value in a data set, μ represents the mean of the data set and N represents the number of values in the data set.
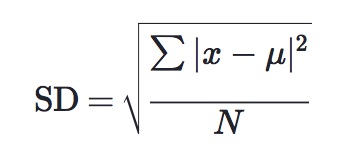
The steps in calculating the standard deviation are as follows:
- For each value, find its distance to the mean
- For each value, find the square of this distance
- Find the sum of these squared values
- Divide the sum by the number of values in the data set
- Find the square root of this
What is standard error?
When you are conducting research, you often only collect data of a small sample of the whole population. Because of this, you are likely to end up with slightly different sets of values with slightly different means each time.
If you take enough samples from a population, the means will be arranged into a distribution around the true population mean. The standard deviation of this distribution, i.e. the standard deviation of sample means, is called the standard error.
The standard error tells you how accurate the mean of any given sample from that population is likely to be compared to the true population mean. When the standard error increases, i.e. the means are more spread out, it becomes more likely that any given mean is an inaccurate representation of the true population mean.
How to calculate standard error
Standard error can be calculated using the formula below, where σ represents standard deviation and n represents sample size.
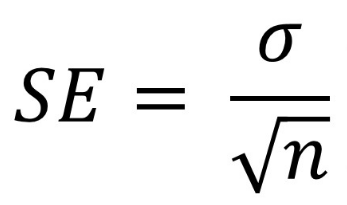
Standard error increases when standard deviation, i.e. the variance of the population, increases. Standard error decreases when sample size increases – as the sample size gets closer to the true size of the population, the sample means cluster more and more around the true population mean.
Images:
Image 1: Dan Kernler via Wikipedia Commons: https://commons.wikimedia.org/wiki/File:Empirical_Rule.PNGÂ
Image 3: https://toptipbio.com/standard-error-formula/
Sources:
http://www.statisticshowto.com/probability-and-statistics/standard-deviation/
http://www.statisticshowto.com/what-is-the-standard-error-of-a-sample/
https://www.statsdirect.co.uk/help/basic_descriptive_statistics/standard_deviation.htm
No Comments on A beginner’s guide to standard deviation and standard error
Haciendo fácil lo que parece estar escrito a veces en idioma marciano.
30th December 2022 at 2:28 am¡EXCELENTE!… ayuda memoria
Your image with the plot showing the normal distribution is wrong.
23rd December 2022 at 5:57 amIt considers the ranges incorrectly.
The range with 68% of the data is said to be “one standard deviation”, where actually, the whole range encompasses 2 standard deviations.
See this image as an example:
https://www.google.com/url?sa=i&url=https%3A%2F%2Fexamples.yourdictionary.com%2Fexamples-of-standard-deviation.html&psig=AOvVaw0ZYzENvhtbm8gHxFLSs8l6&ust=1671861283595000&source=images&cd=vfe&ved=2ahUKEwjrhNPgho_8AhV2upUCHWTaADYQjRx6BAgAEAo
It’s a very easy and clear explanation. Thanks and good luck, Ramzy
21st December 2022 at 6:25 pmGood explanation
13th October 2022 at 8:23 amDoes the standard deviation length make a difference. What length should I use on a 3 month daily chart?
4th October 2022 at 7:46 pmYou say:
“In any distribution, about 95% of values will be within 2 standard deviations of the mean”.
That’s not true. It is expected for gaussian (or “normal”) distributions. It’s doesn’t apply to “any distribution”.
You can find this even in your references
24th March 2022 at 6:24 pmhttp://www.statisticshowto.com/probability-and-statistics/standard-deviation/
https://www.bmj.com/about-bmj/resources-readers/publications/statistics-square-one/2-mean-and-standard-deviation
or elsewhere
https://en.wikipedia.org/wiki/Standard_deviation
simple, yet so profound
24th November 2021 at 1:09 amawosome
21st November 2021 at 8:05 pmVery Good.
13th October 2021 at 9:39 amthe exam is just after an hour and I swear I understood this whole topic within 2 minutes, thanks a lot.
20th September 2021 at 8:42 amHow do i differentiate variance,standard deviation and standard error
14th March 2021 at 4:42 pmThis is well simplified.
19th November 2020 at 11:07 amHi, Thank you! I’m pretty sure the formula for standard deviation has a mistake in it. The denominator should be n-1.
23rd October 2020 at 6:25 amHi Wesley. Thank you for the comment. From the resource that Eveliina has used for this calculation (https://www.khanacademy.org/math/probability/data-distributions-a1/summarizing-spread-distributions/a/calculating-standard-deviation-step-by-step) it confirms that the formula she has used is to calculate the standard deviation of a population. There is indeed a different formula, which uses n – 1 rather than N, when calculating the standard deviation of a sample. The resource here provides a really good explanation too. Hope that proves useful. Many thanks, Emma.
23rd October 2020 at 10:08 amStandard Deviation is the square root of variance, so its kind of trivial to state the conclusion about the increasing standard error with respect to standard error.
Also please look into the symbol of sigma mentioned in the explanation of standard error.
It is a good write up
6th October 2020 at 4:15 pmThank you for flagging the symbol errors on the page Rohit. These have been updated now. Many thanks, Emma.
6th October 2020 at 4:56 pmI was not able to understand standard error. The procedures for calculating is given but i cant understand the process of calculation.
4th August 2020 at 8:47 amIt’s a good attempt and i will like to no more.
24th June 2020 at 9:35 pmThanks for your illustrations.
But, can you clarify when to incorporate SE in our research results and how to interpret ?
Thanks again
19th February 2020 at 1:46 pmHow do you then determine the sample size with the most minimal acceptable standard error. Because you need to have obtained the sample before you can determine standard deviation?
9th December 2018 at 10:05 amexcellent explanation of the concepts
5th November 2018 at 9:35 pmVery simply and nicely explained. Thanks!
2nd October 2018 at 5:28 am