Predictive value: an introduction
Posted on 26th May 2015 by Dabean Faraj

The terms ‘positive predictive value’ and ‘negative predictive value’ seem like difficult and confusing concepts; not least because of how similar they sound. Fundamentally, they are terms used when analysing the data in screening programmes.
Detail
In reality, when people undergo screening programmes, the tests aren’t 100% fool proof. There is room for error. This significantly affects the screening programme. How? Imagine a whole group of people who are screened for a disease – some will test ‘positive’ (suggesting they have the disease). And some will test ‘negative’ (suggesting they don’t have the disease).
But because the screening tests aren’t 100% ‘correct’, you cannot assume that someone who has the disease will definitely test positive. Nor can you assume that someone who definitely doesn’t have the disease will test negative. This is where the predictive value comes in handy.
But what does this mean?
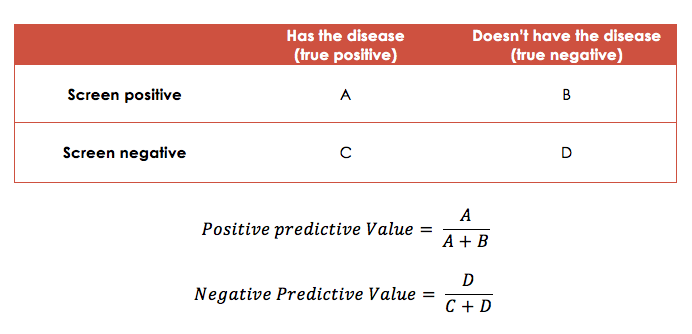
The positive predictive value (PPV) tells you how likely it is for someone who tests positive (screen positive) to actually have the disease (true positive). It answers the question, “I tested positive. Does this mean I definitely have the disease?”
Equally the negative predictive value (NPV) tells you how likely it is for someone who tests negative (screen negative) to not s have the disease (true negative). I.e. it answers the question “I tested negative. Does this mean I definitely don’t have the disease?”
Calculation and interpretation
The following table shows you how to calculate the predictive value. It can help further understand the concept. After calculating the predictive value, interpreting it is simple. The higher the value for the PPV/NPV, the more accurate the test is. And therefore, the better the screening programme!
Final Thoughts
As I said before, I think that these two concepts can be easily confused. However, the table above illustrate. My advice would be to draw out that table quickly in a situation where you think you may need to discuss or work out the predictive value; I have certainly done this and it has been super helpful!
Useful link
I found this link really helpful and recommend checking this out as well!
http://sphweb.bumc.bu.edu/otlt/MPH-Modules/EP/EP713_Screening/EP713_Screening5.html


No Comments on Predictive value: an introduction
Hi Channa. Thank you for your comment. I can see that the way the formulas are presented may cause some confusion (partly due to the column headings I think). In this example, the corresponding letters are as follows:
15th February 2023 at 9:47 amA = True positive
B = False positive
C = False negative
D = True negative
So following through your correct example in your comment, then this does indeed match this example. If we were being strict, then the Negative Predictive Value in this example would read: D / (D+C) but the same result is gained.
Your formulas for positive and negative predictive values are wrong. The right formulas are PPV = TP / (TP + FP) and NPV = TN / (TN + FN).
13th February 2023 at 11:39 am