Measures of central tendency in clinical research papers: what we should know whilst analysing them
Posted on 21st October 2021 by Tarik Suljic

Introduction
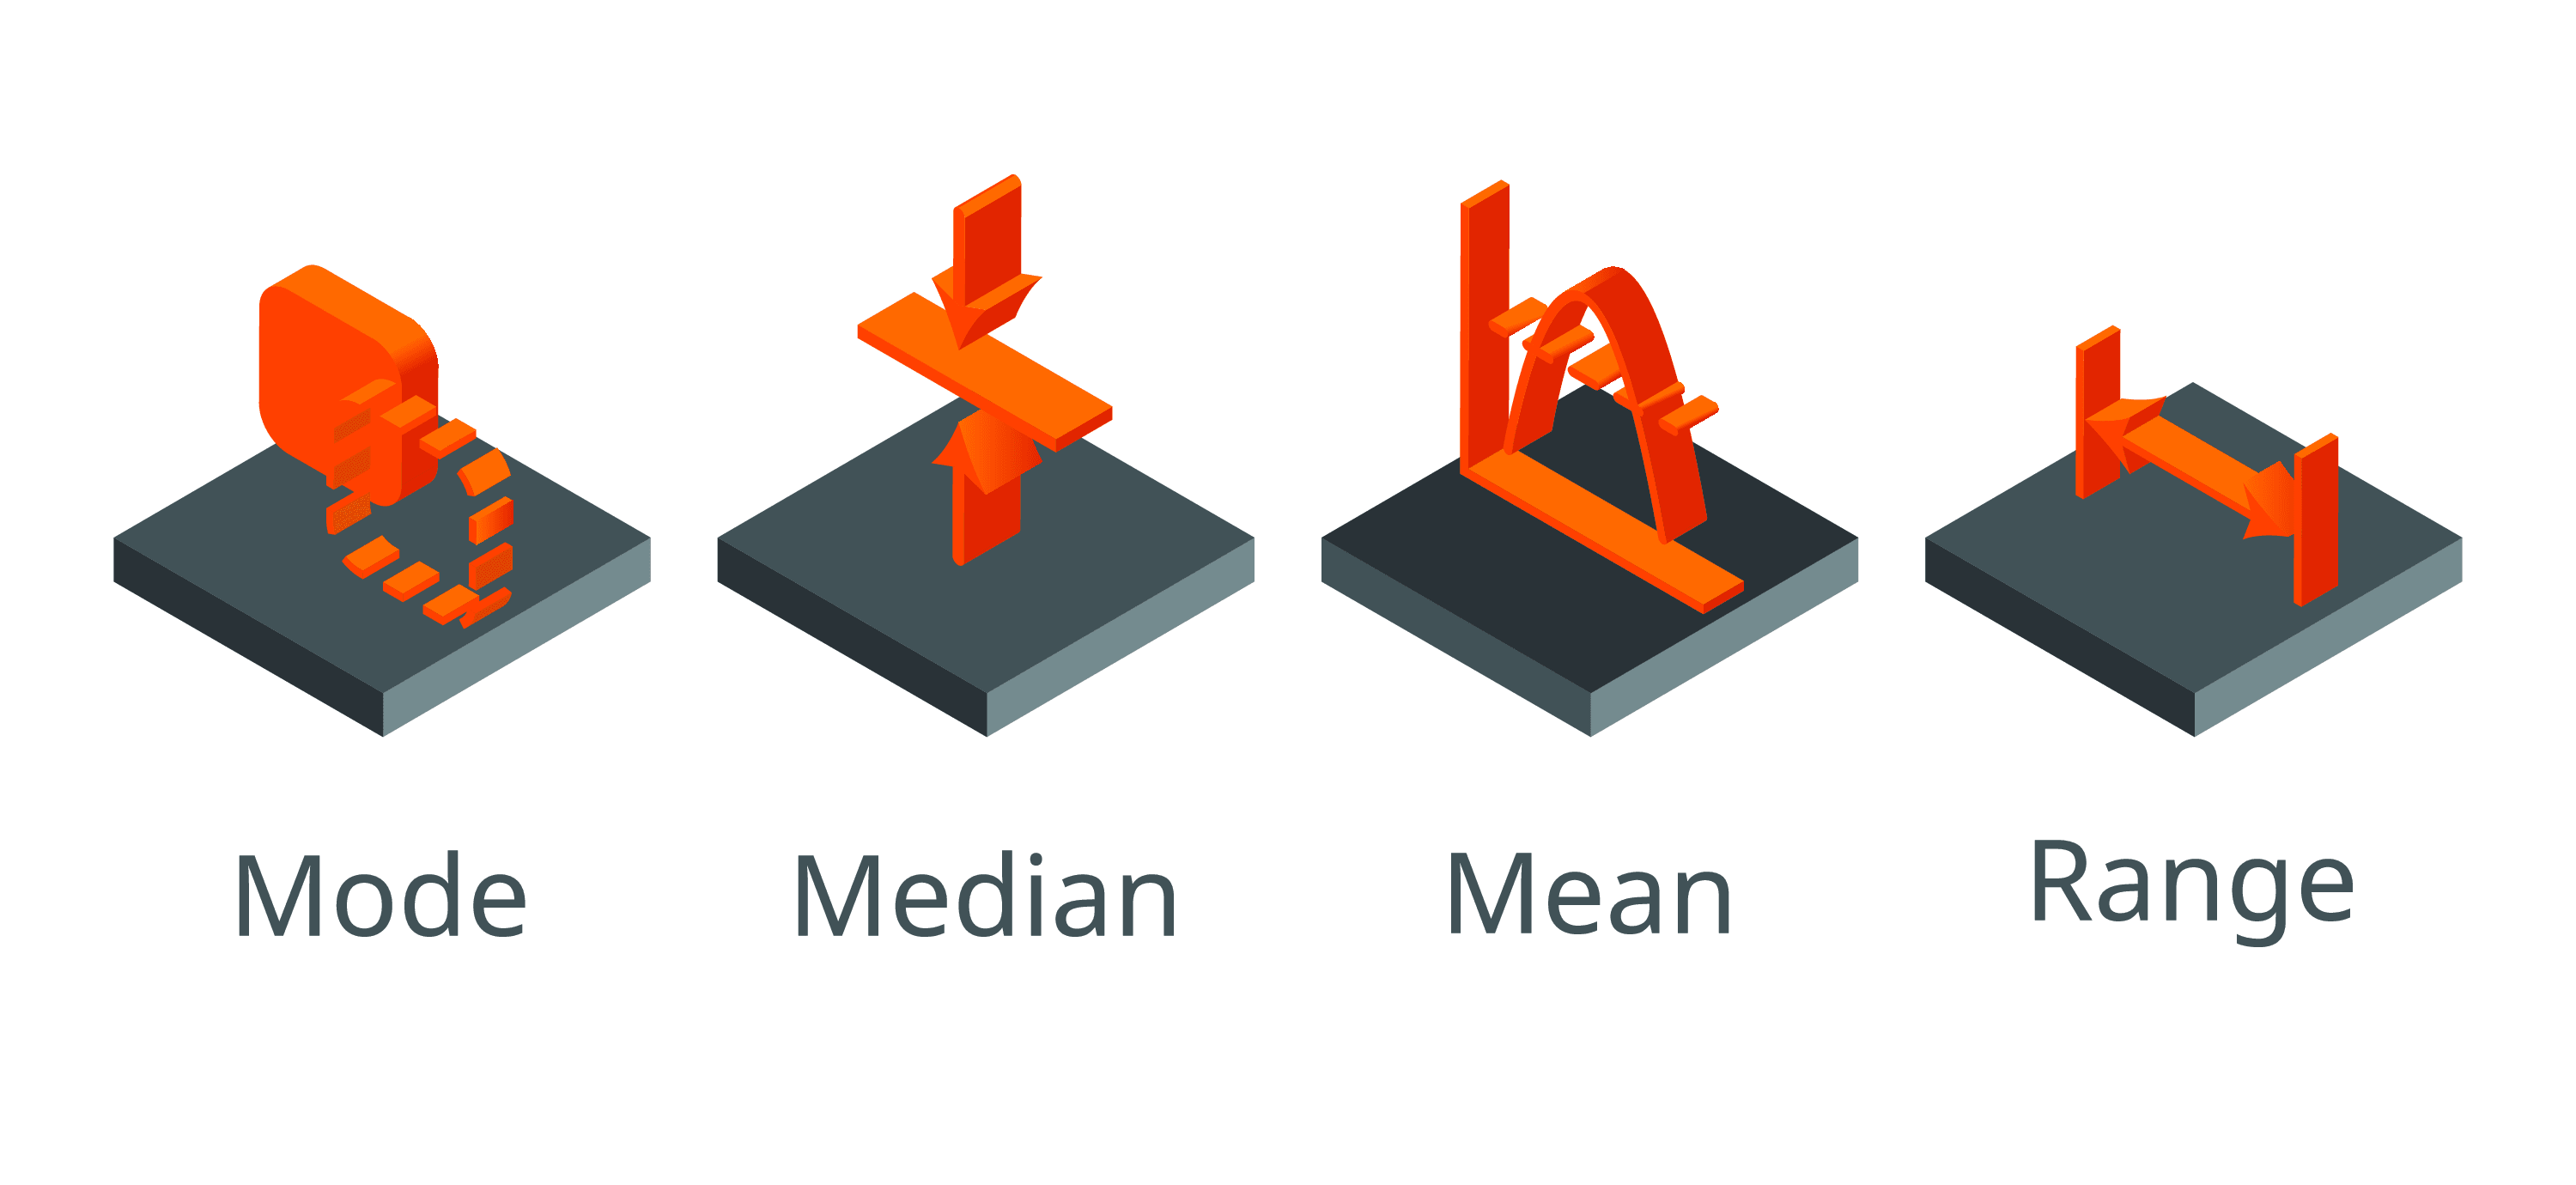
Measures of central tendency (MCT) are values that help us understand where the middle of our dataset is and thus, around what value our dataset gravitates. Traditionally, we can divide MCT into three groups:
- Median;
- Mode;
- Mean.
We can further expand the mean and divide it into three types:
- Arithmetic mean;
- Geometric mean;
- Harmonic mean.
However, for pragmatic purposes, we should consider the characterisation of MCT in two categories:
- Means – which are composed of the already listed types of means, and
- Middle numbers – which are composed of median and mode.
In this way, we obtain two separate categories that require different methods to be reported in a paper. Means are numbers that we obtain by performing mathematical calculations whether the dataset is sorted or not; however, middle numbers are required to be found and not calculated. In the case of middle numbers, we need to have a pre-sorted dataset when we want to find the median only.
The most used MCT in clinical research papers
So, let’s consider that we have the following primary data from patients who have undergone phlebotomy for determining blood sugar concentration (in mM):

From here, we can easily calculate the arithmetic mean and modus, but we cannot find the median. For the median to be found, the dataset needs to be sorted either from the highest to lowest value or vice versa. So, let’s sort it from the lowest to the highest value:

Arithmetic mean
Now, to calculate the arithmetic mean, we need to sum up all of the values and divide them by the total number of entries. The sum of all the values is 104.9, and we have 20 samples (entries), so the arithmetic mean is calculated as follows:
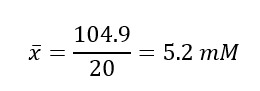
This tells us that the average blood sugar level in the sample of 20 patients is 5.2 mM.
Modus
Proceeding to find the mode, which is defined as the most frequent modality of variable, we can find it in the following table of frequencies:
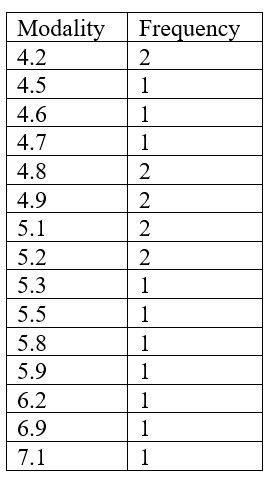
According to this table of frequencies, the greatest frequency number is 2, which means that at least one modality appears in the dataset twice. However, we can see that several modalities appear twice. In such instances, when there are more than three modalities that repeat in the dataset with the greatest frequency number, we call such a dataset polymodal.
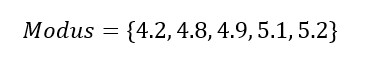
Thus, our modus would be as follows:
If we were to have only one modality that repeats itself more than any other modality, the dataset would be called unimodal. If there were two or three modalities that repeat themselves an equal number of times, such datasets would be called bimodal and trimodal, respectively.
What modus tells us is basically which values in a dataset are the most frequent. In this case, the most frequent blood sugar concentrations in the sample of 20 patients are 4.2 mM, 4.8 mM, 4.9 mM, 5.1 mM, and 5.2 mM.
Median
Proceeding further to find the median point in the list, which divides our dataset into two equal parts, we need to use a very simple formula:
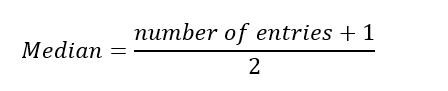
The number of entries in our dataset is 20, and once we add 1 from the formula, we get 21. Next, we divide 21 by 2 from the formula to get 10.5. This number is not our final solution – it just tells us the location of the solution in a pre-sorted dataset. So, we now know that our median is half way between the 10th and 11th items on our list. To find that value, we calculate the mean of those 2 numbers which is: 5.1 + 5.1 / 2 = 5.1 mM.
Clearly this would be easier to calculate if our dataset was an odd number. For example, if our dataset consisted of 9 entries, the position of the median in our list would simply be the fifth entry of the pre-sorted dataset.
Issues with reporting MCT in research papers
MCT are located around values that dominate, are the most frequent, and have the lowest deviations. They take into consideration the whole dataset, but they ignore individual and extreme values. In order for them to reflect real circumstances, they need to be correctly calculated or found and they need to be contextually correct. The latter requirement is very important and is, in fact, a fundamental requirement for the majority of, if not all, statistical measures. We can perform a variety of statistical analyses but report only some of them, and those statistical analyses we report may provide suboptimal data which, in return, may lead to faulty data interpretation. Therefore, in order to choose a correct MCT, we need to be familiar with:
- nature, type, and characteristic of a research topic;
- homogeneity of the data;
- research objectives.
Let’s examine this through an example…
Background knowledge: A chronic myelogenous leukaemia is a type of leukaemia that affects the myeloid lineage of leukocytes (granulocytes) and is associated with the BCR-ABL translocation – Philadelphia chromosome. According to the American Cancer Society, the average age at diagnosis is around 64 years and is rarely seen in children.
Brainstorming: Let’s now think about what would be the ideal study population for research that tests two drugs for their effectiveness. Would such a study population include children or not? What would be the ideal minimum age limit of a participant?
Considering the average age at diagnosis is 64, it would not be good to include participants that are 20 or more years younger than this.
Critical Appraisal: If there was research that included participants below, let’s say, 18 years old, would the results be clinically significant? Could there be some confounding bias? In which case would it still be significant? These are some of the questions that we need to ask ourselves.
When clinicians read intervention research papers, they are usually interested in the effectiveness of one treatment compared to another, and possibly a substantial number of doctors take published papers for granted, especially if they are published in respected and/or peer-reviewed journals. However, that may not always be the case as statistics can be manipulated.
In such cases, an obvious confounding bias would be the different physiological status between an 18 and 60-year-old individual. If the research contained more individuals who were younger, the results would barely reflect and be clinically significant to older individuals. However, should the number of younger individuals included in the research be small, then the results could be clinically significant for elderly patients.
Example: In a research paper published in Clinical Lymphoma, Myeloma, and Leukemia in 2017, researchers investigated efficacy and safety of branded vs. generic imatinib. Regardless of their results, they reported the following data:
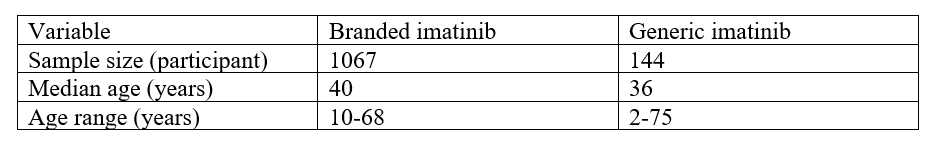
Albeit the median age values are close to the average age at diagnosis according to the American Cancer , the age ranges are very worrying as they included very young patients in the statistics. Now, by simply looking at the median age in both groups, we cannot infer any meaningful conclusion except that the ages 40 and 36 divide the two intervention groups into halves – they are the median ages of each group. Moreover, the number of participants in the groups should be noted; branded imatinib has approximately 7 times more participants than the generic group.
Exercise: From here, the question arises: could it be that the branded imatinib group has had a greater number of younger individuals than the generic? If so, what do you think? Which MCT would provide us with clearer information: average or modus?
Conclusion
The measures of central tendency help us understand the middle of our dataset, a place that is supposed to occupy around 68% of area under the bell curve. However, these measures do not inform us about the lateral parts under the curve which are thought to contain less common or extreme values. The most common measures of central tendency in clinical research include arithmetic mean, modus, and the median. In basic research, however, geometric mean is mostly found, and in public health management research harmonic mean finds its place. Considering the well-known fact that statistics can be manipulated for various purposes, it is quite important that is correctly interpreted. This means that critical appraisal of research articles ought to be conducted with the help of (bio)statistics and the background knowledge which navigates the interpreter through the paper in order to spot or exclude a possibility for faulty or misleading evidence.
References (pdf)
You may also be interested in reading these blogs:
A beginner’s guide to confounding
Peer-review and publication does not guarantee reliable information